引言
最近在项目中进行了大数据量下的性能测试, 在寻找性能瓶颈过程中,利用go tool pprof工具, 解决了内存大量申请释放, 业务逻辑等问题;
本文主要分为三部分:
go tool pprof的介绍;go tool pprof的使用方式的介绍;项目实践检验
缘由
为何需要性能分析?
性能分析与优化是程序迭代过程中不可避免的步骤, 其好处不限于: 提高程序效率, 减少资源利用, 支持系统可扩展性, 提升用户体验等等. 在网络上, 对于性能优化的必要性讨论很多, 理解各有千秋, 例如知乎博主认为是由于服务在扩展, 架构需重构, 服务需压测等原因;
总而言之, 有编码的地方, 就有BUG, 就有可优化空间; 就需要利用性能分析工具, 解决 业务逻辑问题, 内存申请过大问题, 内存泄露问题, 协程泄露问题…
性能分析工具五花八门, 引用自:
1 | vmstat、iostat、 mpstat、netstat、 sar 、top:查看系统、程序信息等 |
对于go程序, 推荐使用go标准工具: go tool pprof, 进行性能分析, 问题定位; 这也是本文的主角:go tool pprof;
定义: go tool pprof
现状:
go在2011年go blog pprof 初次介绍了go tool pprof工具的基本使用方式, 提供了CPU, Memory性能分析指导. 经过了多次迭代优化: 内置了火焰图, 扩展了可分析范围, 例如:
1 | // cpu |
借助于go tool pprof , 编码人员可以有效分析性能瓶颈, 提升性能表现.
PS: 随着工具的成熟, 在go 1.21 版本, Go Official Intro About PGO, go已经初步通过FDO流程的方式实现Go编译器自动优化代码性能表现;
定义
其定义为:
pprof is a tool for visualization and analysis of profiling data.
pprof 是用于分析profiling data并生成可视化报告的工具;
定义解释:
这一部分可以不看
什么是profiling data?
主观的说
profiling data指的是程序的性能状态数据, 直译为配置文件, 为了防止误解, 本文选择使用profiling data原文标识;PS:
profiling的理解各异, 其直译为画像, 轮廓, 有人称其为当前应用状态的画像, 有人称其为prof文件, 有人称其为采样文件. 在我看来, 上面的理解都对,profiling data就是runtime/pprof经过采样后获得应用状态样本集合;客观的说:
profile.proto is a protocol buffer that describes a set of callstacks and symbolization information. A common usage is to represent a set of sampled callstacks from statistical profiling. The format is described on the proto/profile.proto file. For details on protocol buffers, see https://developers.google.com/protocol-buffers
pprof operates on data in the profile.proto format. Each profile is a collection of samples, where each sample is associated to a point in a location hierarchy, one or more numeric values, and a set of labels. Often these profiles represents data collected through statistical sampling of a program, so each sample describes a program call stack and a number or value of samples collected at a location. pprof is agnostic to the profile semantics, so other uses are possible. The interpretation of the reports generated by pprof depends on the semantics defined by the source of the profile.
profiling data是程序调用栈的信息集合,也是样本的集合, 其符合profile.proto格式. 每一个样本都指向了一个location hierarchy, 其包含有一系列的标签及对应的值(数字/字符串).- 这里有一个疑问点: 什么是
location hierarchy, 直译为位置层次结构.我个人理解为: 调用栈结构, 例如:- 在
CPU Profile采样过程中, 其指代的通过程序计数器 PC获得的调用栈情况, 其衡量指标为: 每个函数的时间开销等; - 在
Heap Profile采样过程中, 气质带通过内存分配器获得的调用情况, 其衡量指标为: 内存分配大小等;
- 在
细致的解释, 我这里暂时没有去梳理, 可以参考相关文章, Google About Pprof README, Google About Protocol-buffers.
- 这里有一个疑问点: 什么是
细节:
这一部分内容, 可看可不看, 不影响使用pprof的核心功能;
profiling data 文件内容
上一部分有讲到profiling data包含有location hierarchy, 其构成了samples. 每一个location 包含有两类值:
flat:location本身的值,例如对于cpu time就是函数本身的执行时间;cum:location本身及child location的值的合, 例如对于cpu time就是函数与其子函数的执行时间合;
上面的提到的flat, cum可以说贯通了pprof命令中, 就像是砖块与水泥, 可以搭建出各种需求的建筑物;
pprof 命令功能点梳理
通过go tool pprof 命令的details部分, 可以看到官方梳理的功能点;
1 | [root@sangfor ~]# go tool pprof |
这里不做赘述,仅对功能项进行梳理,了解go tool pprof CLI 可以做什么即可;
| 功能 | 相关命令 | 示例 | 备注 | |
|---|---|---|---|---|
| 1 | 指定输出格式 | -list -svg -top -web ... |
go tool pprof -top ./cpu.prof 指定交互模式中TOP命令, 按照flat逆序排序 |
部分格式需要依赖第三方包, 例如web; |
| 2 | Node过滤 | -focus -hide -ignore ... |
go tool pprof -focus=find ./cpu.prof 指定过滤出匹配find正则表达式的samples |
五花八门的过滤选项 |
| 3 | 聚合 | `-functions -files -lines | go tool pprof -files ./cpu.prof, 指定sample按照file维度聚合 |
默认按照function维度聚合 |
| 4 | 排序 | -flat -cum |
go tool pprof -files -cum ./cpu.prof, 指定按照文件聚合, 并且通过cum维度逆序排序; |
仅有两个排序选择 |
| 5 | 源.prof文件处理 | -diff_base, -base ... |
go tool pprof -diff_base ./v1/cpu.prof ./v2/cpu.prof 展示两个cpu.prof文件之间的差异 |
没有实践过 |
| 6 | 选择交互模式 | -http -tools -no_browser |
go tool pprof -http=0.0.0.0:1234 ./cpu.prof, 通过Web方式交互 |
最常用-http |
| 7 | 便捷选项 | -alloc_space -inuse_objects ... |
go tool pprof -alloc_space ./v3/mem.prof 通过 历史分配空间维度 查看mem.prof文件; 等于 -sample_index=alloc_spac |
不同类型文件的选择式不一样的,例如内存prof文件就可以指定 space, objects等 |
在我自己的使用经历来看, 使用go tool pprof -http=host:port source的方式, 在Web页面上的选择已经基本上覆盖了所有的Cli使用方式。
流程
这一部分介绍pprof的使用方式, 参考: Google About Pprof README; pprof 工具的使用围绕于profiling data, 那么可以分为两部分:profiling data 的生成, 分析profiling data;
1. profiling data 生成:
相关pkg:
runtime/pprof: 官方推荐标准包: 通过runtime获得profiling data, 一般适用于可结束代码, 例如Utils App;net/http/pprof: 官方推荐标准包: 支持通过HTTP Request获得profiling data, 一般适用于不可结束代码, 例如Web App;其内部封装了
runtime/pprof包, 在程序启动前自动注册/debug/pprof/路由, 方便触发式调用;
理论上说: 任何封装了runtime/pprof的pprof工具包, 均可以用于profiling data生成;
获得profiling data的方式:
按照目标代码可以分为两种:
测试代码
通过测试代码_test.go获得profiling data:
go test 基准测试bench内嵌了runtime/pprof, 可通过options获得:
1 | go test -cpuprofile cpu.prof -memprofile mem.prof -bench . |
程序代码
通过程序代码.go获得, 这种方式需要嵌入代码,根据需要选择runtime/pprof, net/http/pprof
选择
runtime/pprof:参考代码示例:
1
2
3
4
5
6
7
8
9
10
11
12
13
14
15
16
17
18
19
20
21
22
23
24
25
26
27
28
29
30
31var cpuprofile = flag.String("cpuprofile", "", "write cpu profile to `file`")
var memprofile = flag.String("memprofile", "", "write memory profile to `file`")
func main() {
flag.Parse()
if *cpuprofile != "" {
f, err := os.Create(*cpuprofile)
if err != nil {
log.Fatal("could not create CPU profile: ", err)
}
defer f.Close() // error handling omitted for example
if err := pprof.StartCPUProfile(f); err != nil {
log.Fatal("could not start CPU profile: ", err)
}
defer pprof.StopCPUProfile()
}
// ... rest of the program ...
if *memprofile != "" {
f, err := os.Create(*memprofile)
if err != nil {
log.Fatal("could not create memory profile: ", err)
}
defer f.Close() // error handling omitted for example
runtime.GC() // get up-to-date statistics
if err := pprof.WriteHeapProfile(f); err != nil {
log.Fatal("could not write memory profile: ", err)
}
}
}上面代码中通过, 命令行
options方式控制,CPU Profile,Memory Profile的生成;选择
net/http/pprof:使用此方式的前提是:
import _ "net/http/pprof"会默认注册/debug/pprof/. 路由到服务中, 通过
http request获得profiling data, 并自动进入交互使用模式 具体为:1
2
3
4go tool pprof http://localhost:port/debug/pprof/profile # 30-second CPU profile
go tool pprof http://localhost:port/debug/pprof/heap # heap profile
go tool pprof http://localhost:port/debug/pprof/block # goroutine blocking profile
...2.
profiling data分析:
live profiling data
查看实时profiling data, 如果使用了net/http/pprof包, 那么在浏览器上可以直接通过URL: localhost:port/debug/pprof/查看实时的profiling data.
这种模式的使用场景, 还是比较少的.
file profiling data
查看序列化的profiling data
使用格式为: pprof <format> [options] [binary] <source> ...
其支持两种格式的分析:
Interactive Terminal Use
终端交互是默认的format, 格式为:
go tool pprof [options] source
source来源可以是本地已保存的
profiling data, 也可以是一个http的debug/pprof请求(也是profiling data), 例如:go tool pprof ./cpu.prof: 分析当前路径下的cpu.prof文件go tool pprof http://127.0.0.1:1234/debug/pprof/profile: 分析30S内的本地1234服务产生的`CPU profiling data``
source格式可以是.pb.gz格式的压缩文件, 也可以是.pb的解压缩文件压缩示例:
1
2
3
4
5
6
7
8./pprof /root/pprof/pprof.cbspsvc-linux.samples.cpu.001.pb.gz
File: cbspsvc-linux
Type: cpu
Time: Nov 22, 2023 at 2:42pm (CST)
Duration: 30s, Total samples = 50ms ( 0.17%)
Entering interactive mode (type "help" for commands, "o" for options)
(pprof)
...解压缩示例:
1
2
3
4
5
6
7
8./pprof /root/pprof/pprof.cbspsvc-linux.samples.cpu.002.pb
File: cbspsvc-linux
Type: cpu
Time: Nov 22, 2023 at 2:46pm (CST)
Duration: 30s, Total samples = 30ms ( 0.1%)
Entering interactive mode (type "help" for commands, "o" for options)
(pprof)
...Interactive Web Use
通过指定format: http, 格式为:go tool pprof -http=[host]:[port] [options] source
pprof 在指定端口,启动http请求, 通过浏览器, 以Web方式查看source, 例如:
以本地地址, 在1234端口, 查看cpu profiling data
1 | [root@]# ./pprof -http=0.0.0.0:1234 /root/pprof/pprof.cbspsvc-linux.samples.cpu.002.pb |
source 文件的来源与格式, 与终端使用无差异;
示例:
这一部分将通过示例的方式展示性能优化分析过程。代码归档地址:github.
示例项目
Go在11年首次提出Profiling Go Program时,采用示例项目为Robert Hundt paper's提出的Loop Recognition Algorithm Code. 原文中提到的优化方式,具备一定的代表性. 本文采用的项目源码与其一致, 将采用了Interactive Web方式复现了原文中的优化措施, 并通过性能对比的方式进一步体现优化效果.
环境信息
CPU:
1
2
3
4
5
6
7
8
9
10
11
12
13
14
15lscpu
Architecture: x86_64
CPU op-mode(s): 32-bit, 64-bit
Byte Order: Little Endian
CPU(s): 4
...
Model name: Intel(R) Core(TM)2 Duo CPU T7700 @ 2.40GHz
Stepping: 11
CPU MHz: 2600.002
BogoMIPS: 5200.00
...
L1d cache: 32K
L1i cache: 32K
L2 cache: 4096K
...内存:
1
2
3
4
5[root]# free
total used free shared buff/cache available
Mem: 16265900 1089812 14215544 19504 960544 14829644
Swap: 2097148 0 2097148Go
1
2[root]# go version
go version go1.16.4 linux/amd64衡量标准
本文采用的衡量指标与Profiling Go Program一致:
1 | [root runtime]# cat xtime |
通过./xtime binaryFilePath 可以获得binaryFilePath下的程序执行的:
%Uu用户CPU执行时间, 单位为秒;%Ss系统CPU执行时间, 单位为秒;%er命令开始到结束时间, 单位为秒;%MKB内存占用大小, 单位为KB;%C传递的命令行参数.
优化前:
构建go program, 并通过xtime获得当前的程序执行情况:
1 | [root v1]# go build ./havlak.go |
在优化前的性能指标为:
| Version | User Time | Sys Time | Memory |
|---|---|---|---|
| 优化前 | 42.51 s | 4.31 s | 316284 kB |
CPU分析
由于项目并非Web类, 属于可结束型代码, 所以采用了runtime/pprof包作为profiling data的生成包;
profiling data 生成:
嵌入
CPU Profile生成代码, 开启CPU Profiling功能;1
2
3
4
5
6
7
8
9
10
11
12
13
14
15
16var cpuprofile = flag.String("cpuprofile", "", "write cpu profile to this file")
func main() {
flag.Parse()
if *cpuprofile != "" {
f, err := os.Create(*cpuprofile)
if err != nil {
log.Fatal("could not create CPU profile: ", err)
}
defer f.Close() // error handling omitted for example
if err := pprof.StartCPUProfile(f); err != nil {
log.Fatal("could not start CPU profile: ", err)
}
defer pprof.StopCPUProfile()
}
....代码位置约为
660行. 添加的代码部分, 其支持通过命令行参数-cpuprofile的方式,指定开启CPU Profiling功能的同时将profiling data输出在cpuprofile文件内;编译代码, 开启
CPU Profiling:1
2
3
4
5
6
7
8
9
10
11
12[root v1]# go build ./havlak.go
[root v1]# ll
total 2492
-rwxr-xr-x. 1 root root 2530010 Dec 25 16:56 havlak
-rw-r--r--. 1 root root 16720 Dec 25 16:44 havlak.go
[root v1]# ./havlak -cpuprofile=cpu.prof
of loops: 76000 (including 1 artificial root node)
[root v1]# ll
total 2528
-rw-r--r--. 1 root root 34063 Dec 25 16:58 cpu.prof
-rwxr-xr-x. 1 root root 2530010 Dec 25 16:56 havlak
-rw-r--r--. 1 root root 16720 Dec 25 16:44 havlak.go在等待约30S后, 获得了
CPU Profiling data:cpu.prof.
profilinf data 分析:
开启
Interactive Web, 查看CPU Profiling data通过
go tool pprof -http=host:port source命令, 可以在指定端口允许通过Web查看CPU Profiling data;1
2
3[root v1]# go tool pprof -http=0.0.0.0:1234 ./cpu.prof
Serving web UI on http://0.0.0.0:1234
http://0.0.0.0:1234上面指定监听
1234端口, 由于本地机器IP为10.131.197.202. 所以可以通过浏览器访问http://10.131.197.202:1234查看交互页面;页面默认展示
Graph VIEW, 默认通过cpu time作为衡量指标, 如下图: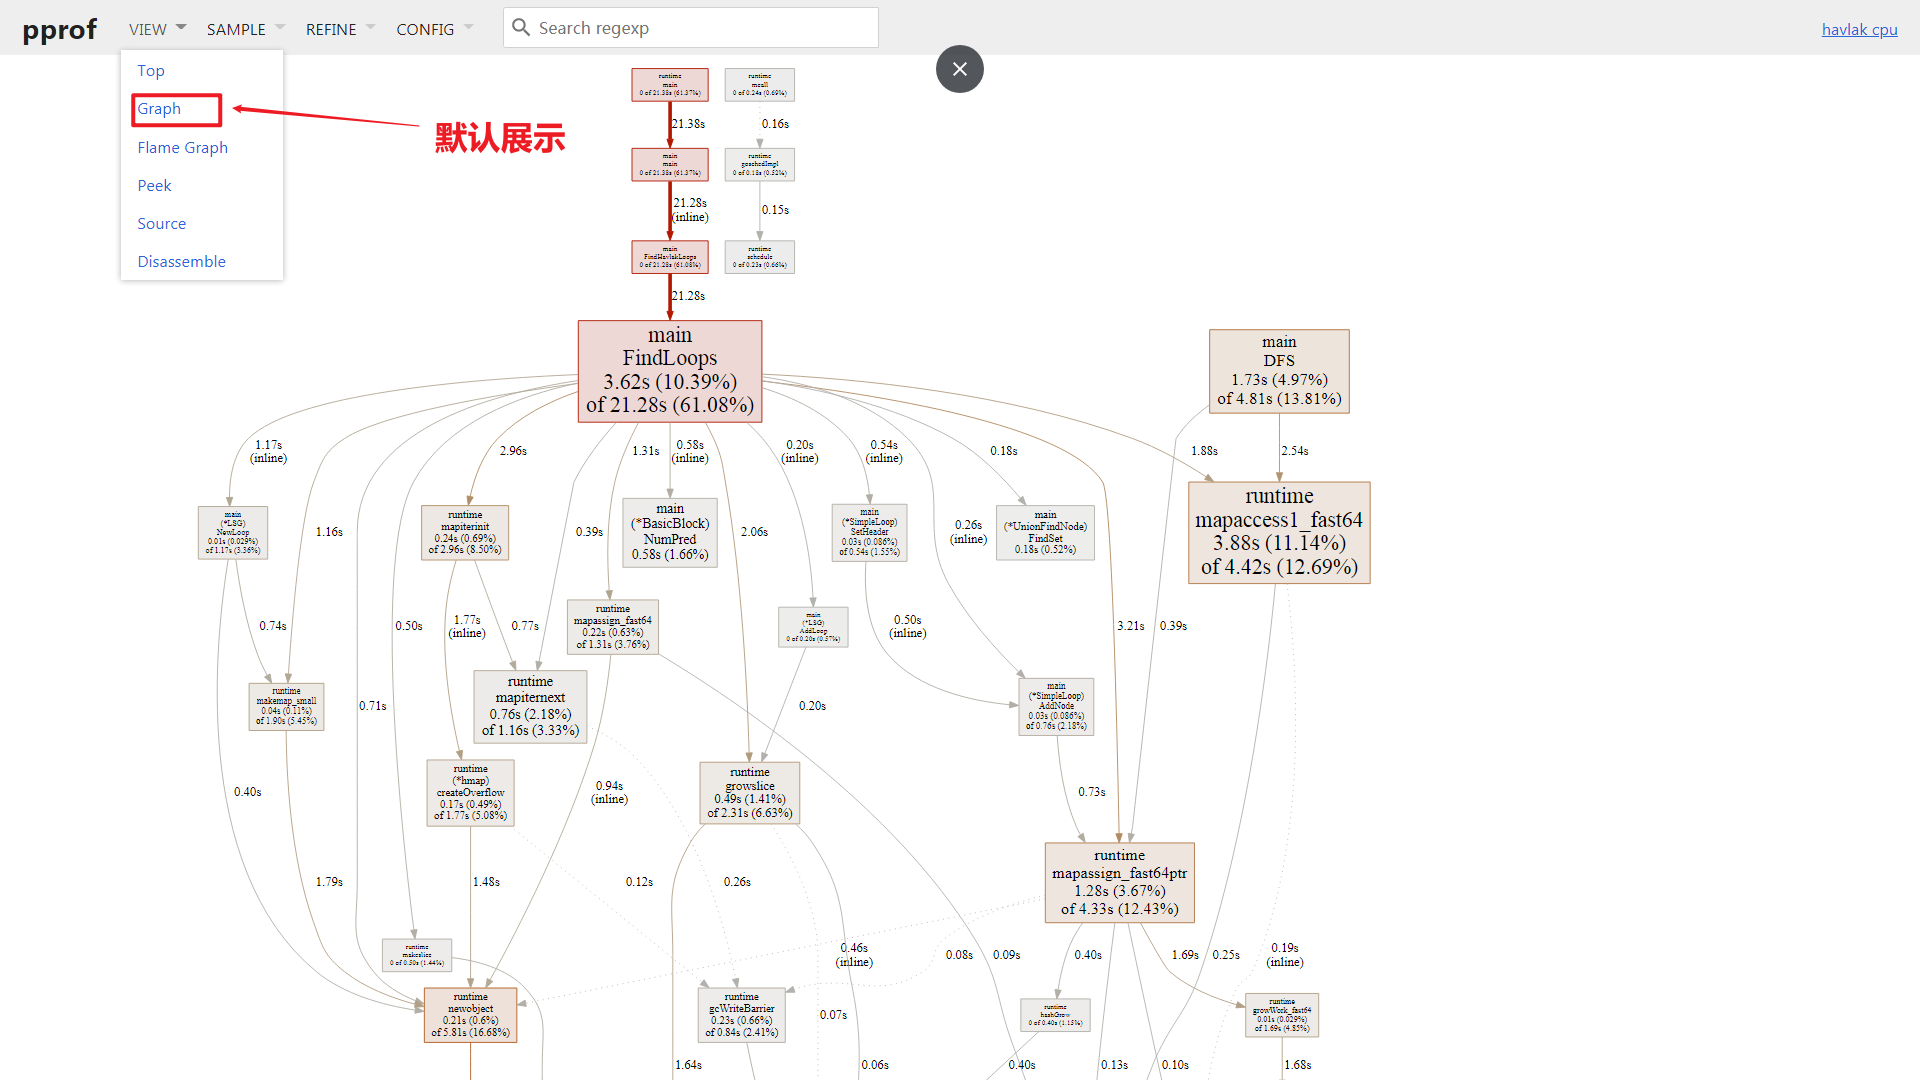
接下来将简单的解释下交互界面元素, 并对每一种
VIEW模式进行简单解读.界面解释:
操作栏:
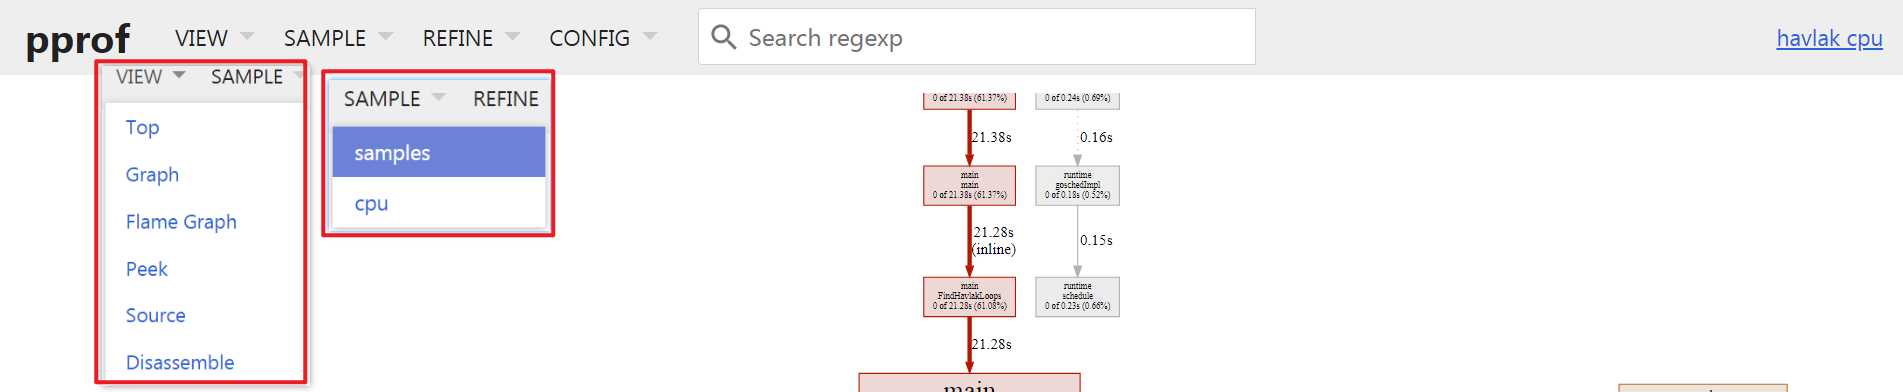
分为4列选项,
VIEW查看模式,SAMPLE样本标签选择,REFINE样本过滤,聚焦等,CONFIG记录配置项;1列正则表达式搜索框;其中
VIEW与SAMPLE就我而言,使用比较频繁, 下面会分别进行简单解释, 详细解释建议自行参考官方文档: Google About Pprof README.VIEW: Top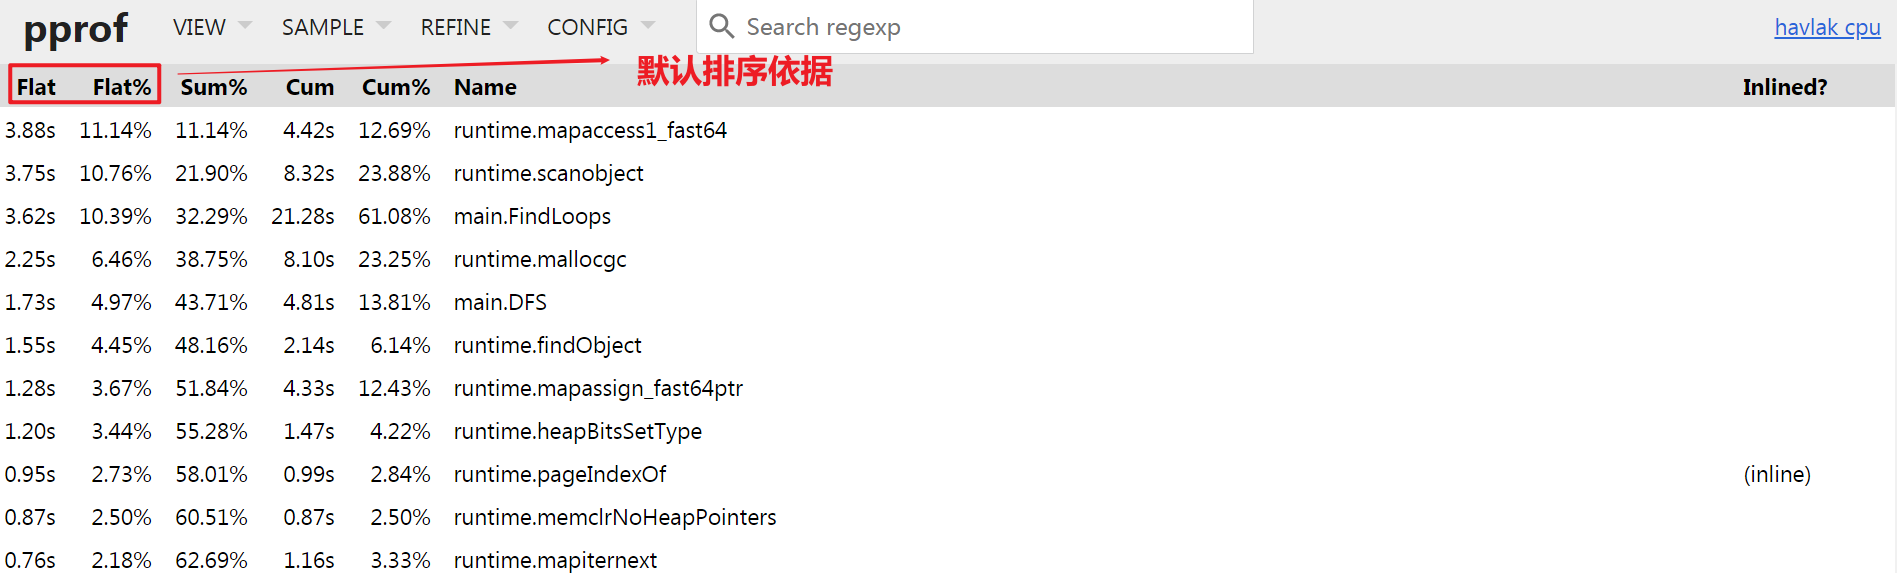
Top模式下默认支持查看Function级别的CPU占用情况, 默认按照Flat时间逆序排序,方便用来分析性能瓶颈;Flat: 当前函数占用的cpu时间, 支持页面排序;Flat%: 当前函数占用的cpu时间比例;Sum%:Flat%的汇总展示, 例如第三行的Sum%就是1.Flat% + 2.Flat% + 3.Flat%;Cum: 当前函数及子函数占用的cpu时间, 支持页面排序;Cum%: 当前函数及子函数占用的cpu时间比例;Name: 包名+函数名称Inlined?: 当前函数是否被编译器通过inline进行了优化.
那么对于第一行来说可以解释为:
runtime.mapaccess1_fast64函数本身执行时间最长约3.88s, 占比约11.14%, 与其子函数共占有4.42s, 占比约12,69%, 并未通过inline优化;VIEW: Graph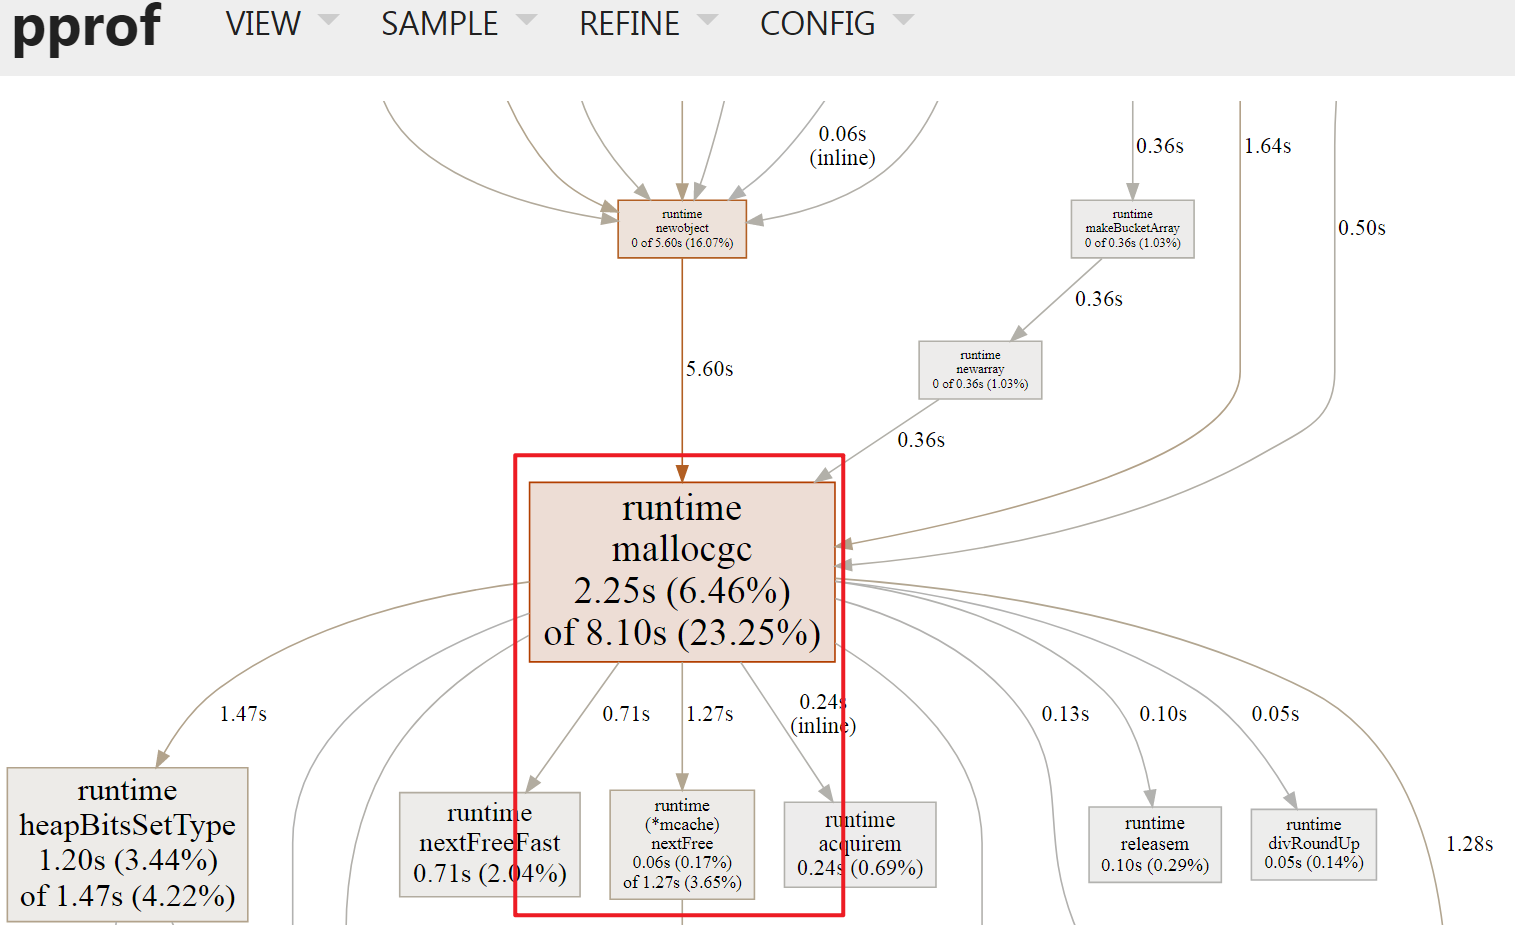
Graph VIEW模式是Web默认模式, 其展示了Function级别的调用关系, 如上图中runtime.mallocgc -> runtime(*mcache).nextFree表示前者调用了后者, 边权重显示为1.27s, 表示runtime(*mcache).nextFree本身及其后续调用花销为1.27s, 具体解释如下, 每一个方框称为Node, 表示一个FunctionNode Color/Size: Size 代表了cum数字绝对值cum -> +∞, Size越大, 颜色越红;cum -> 0, Size越小, 颜色越灰;cum -> -∞, Size越大, 颜色越绿;
Node Font Size: 方框内字体Size代表flat,flat -> +∞: 越大Edge weight: Node之间的边越粗, 代表占有的资源越多, 例如子函数占用的时间;Edge color: 与Node color形式一样Dashed Edge: 虚线边, 表示其中省略了node, 也就是说非直接调用;Solid Edge: 实线边, 表示直接调用;Inline Marked Edge:inline标记的边, 表示子函数被编译器inline优化了;
VIEW: Flame Graph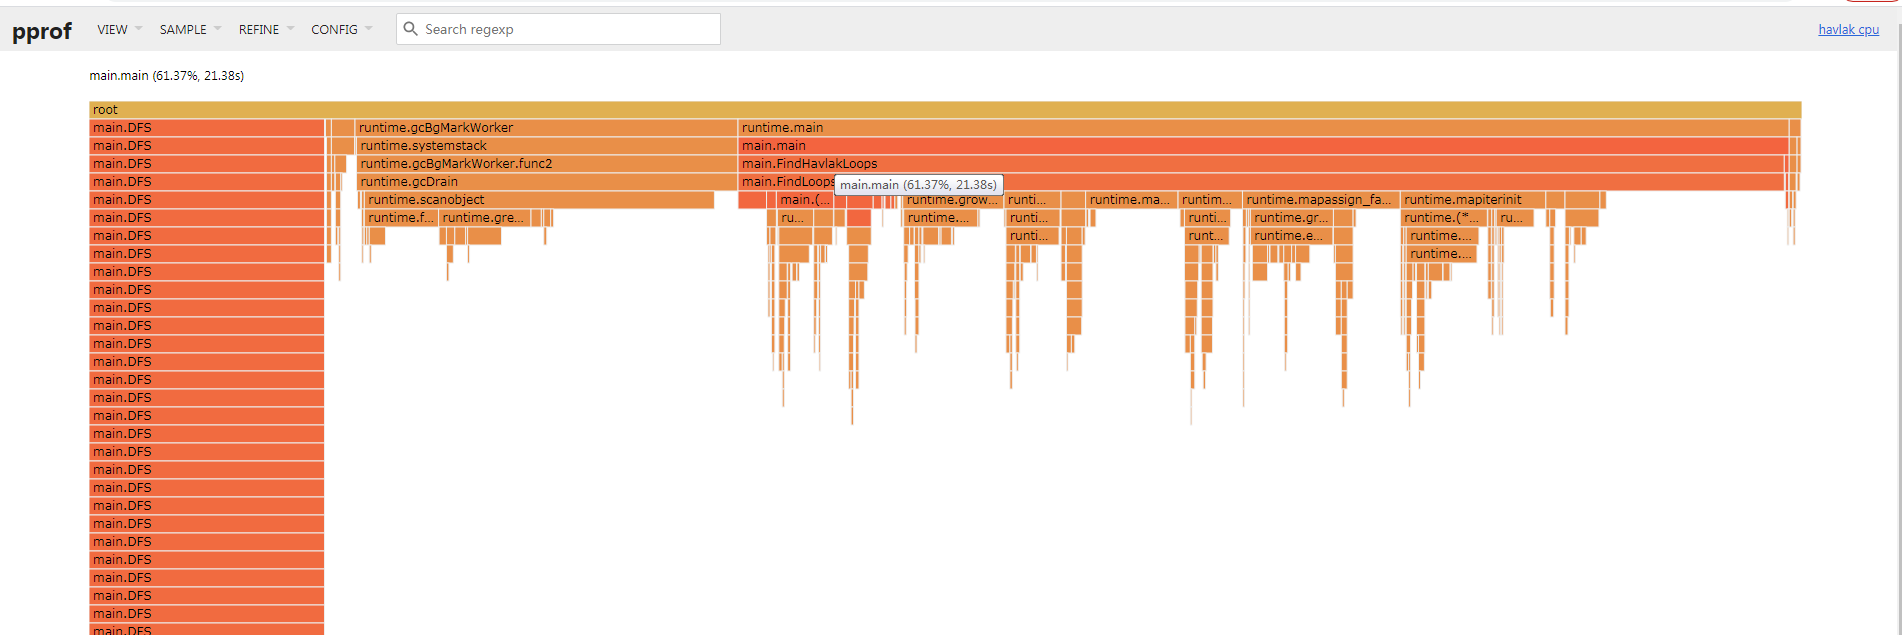
Flame Graph因为其形状像是火焰, 俗称为火焰图; 其表示的是紧密型的函数调用(自上至下)关系;图中的
Box关系与profiling data中的堆栈表示是一致的.每一个
Box宽度表示cum时间. 其子函数位于下一层, 自左向右依次排列在一起, 如果有空余则表示flat时间;点击
Box后会聚焦在此函数, 如下图: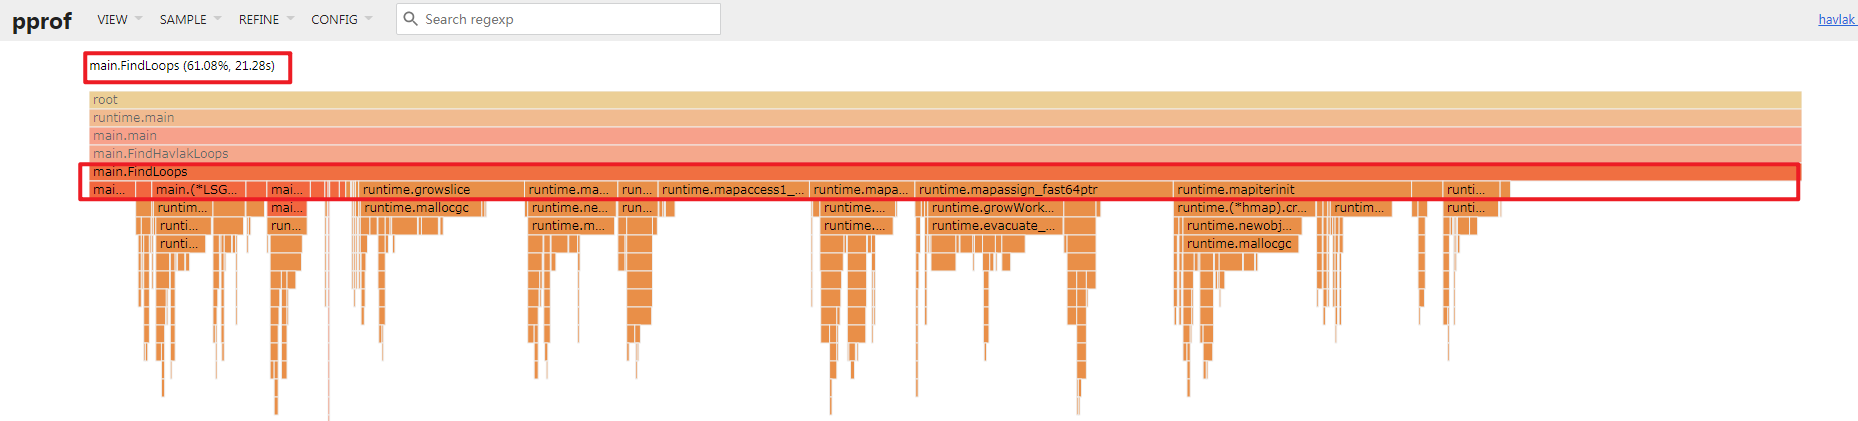
可以看到
FindLoops函数, 其cum开销为21.20s, 调用了诸多子函数, 下一层最右侧空白位置为FindLoops本身的时间开销:flat;PS: 我个人在使用时, 发现在1.21版本的
go tool pprof下的火焰图有了新选项(Flame Graph new), 已经有了更多变化, 官方截图如下: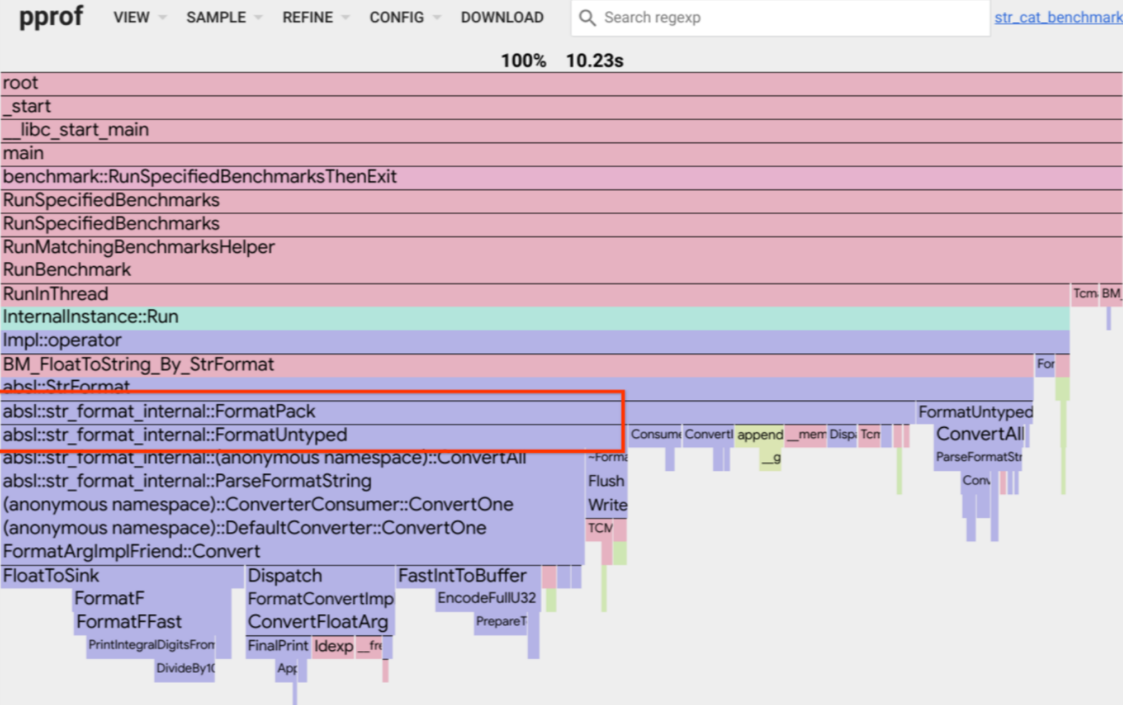
- 加入了颜色标识: 方便识别包;
- 规范了子调用函数的图像展示, 自左至右开销时间依次降低;
- …
VIEW: Peek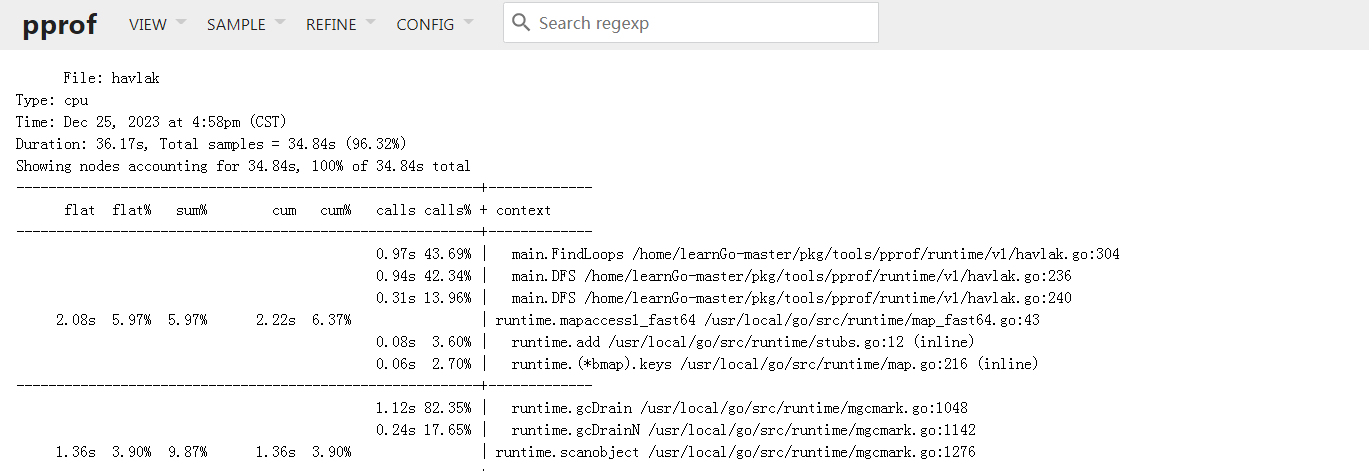
以文本格式展示函数的调用关系, 可读性一般, 可以使用
Graph,Flame Graph替代;VIEW: Source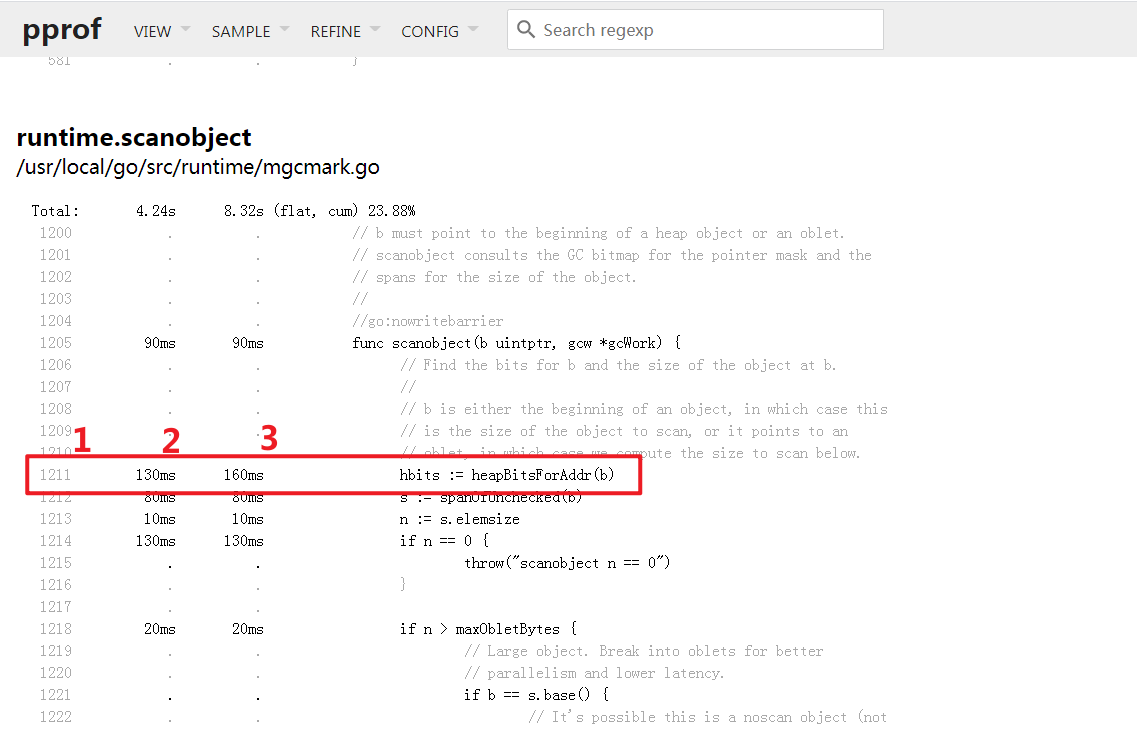
展示了已标注的源码, 左侧有三列, 分别表示 代码行,
flat开销,cum开销; 右侧为源码本身;那么图中表示, 存在
runtime/mgcmark.go文件的1211行的heapBitsForAddr函数本身开销为130ms, 包括其子函数的开销为160ms;本模式一般用于行级别的
BUG排查, 一般已经基本明确瓶颈函数后, 通过上面的正则搜索框进行下一步定位;点击源码可以看到对应的汇编码, 以方便进一步排查;
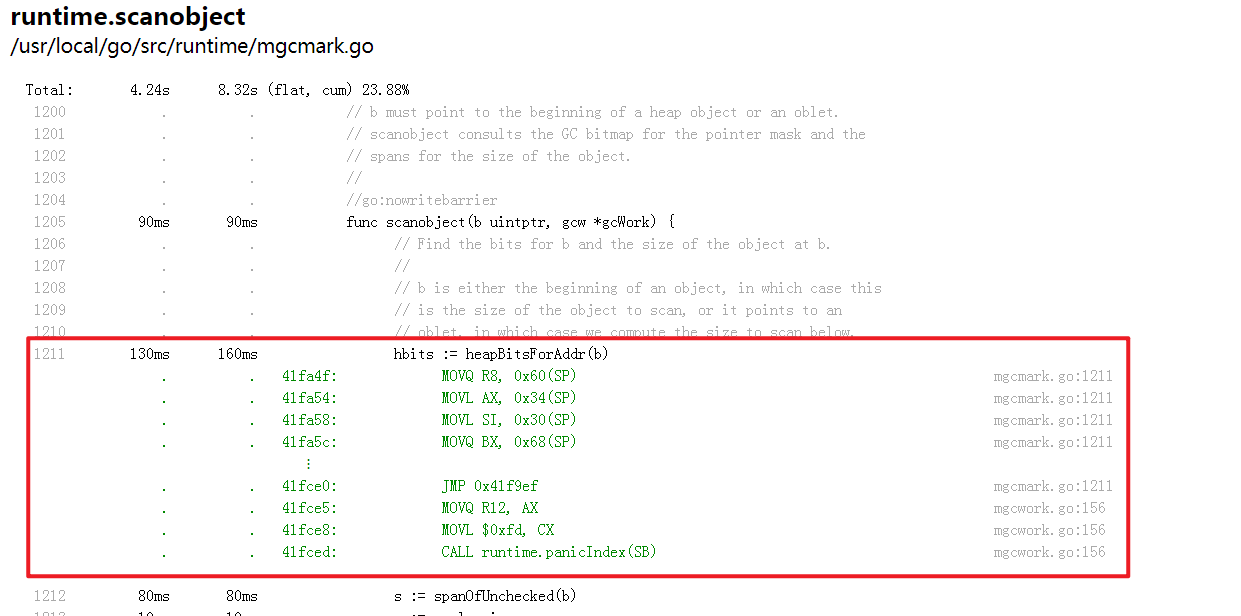
VIEW: Disassemble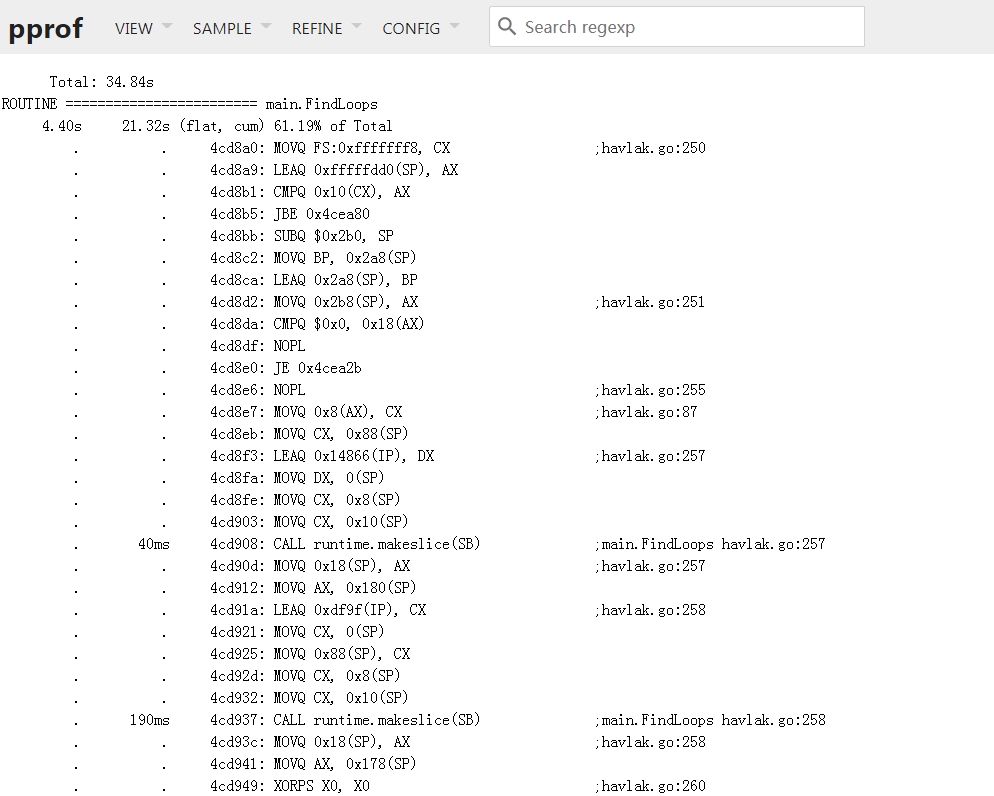
汇编模式查看, 我自己没用过;
分析
首先通过
Top VIEW确定下当前的瓶颈函数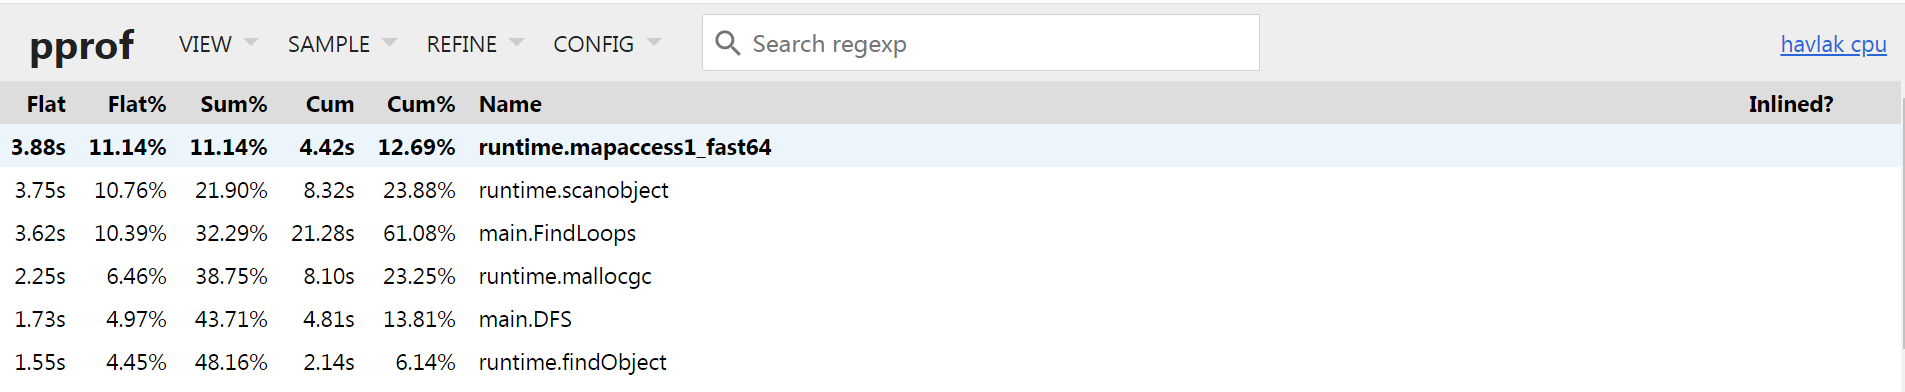
发现
runtime.mapaccess1_fast64函数其flat执行时间最长, 其功能为1
runtime.mapaccess1_fast64 是 Go 语言中的一个内部函数,用于快速访问 map 结构中的元素。它是在编译器生成的代码中使用的,用于优化 map 的访问速度。这个函数的具体实现可以在 Go 语言的运行时源代码中找到。在一般的 Go 代码中,我们并不需要直接调用这个函数,而是通过 map[key] 的方式来访问 map 中的元素。
由于其是
runtime包内的函数, 不是业务代码, 而我们需要优化的是业务代码, 可以通过Graph VIEW查看其调用路径;其次通过
Graph VIEW查看, 借助于正字表达式过滤, 可以排除无效的分支干扰: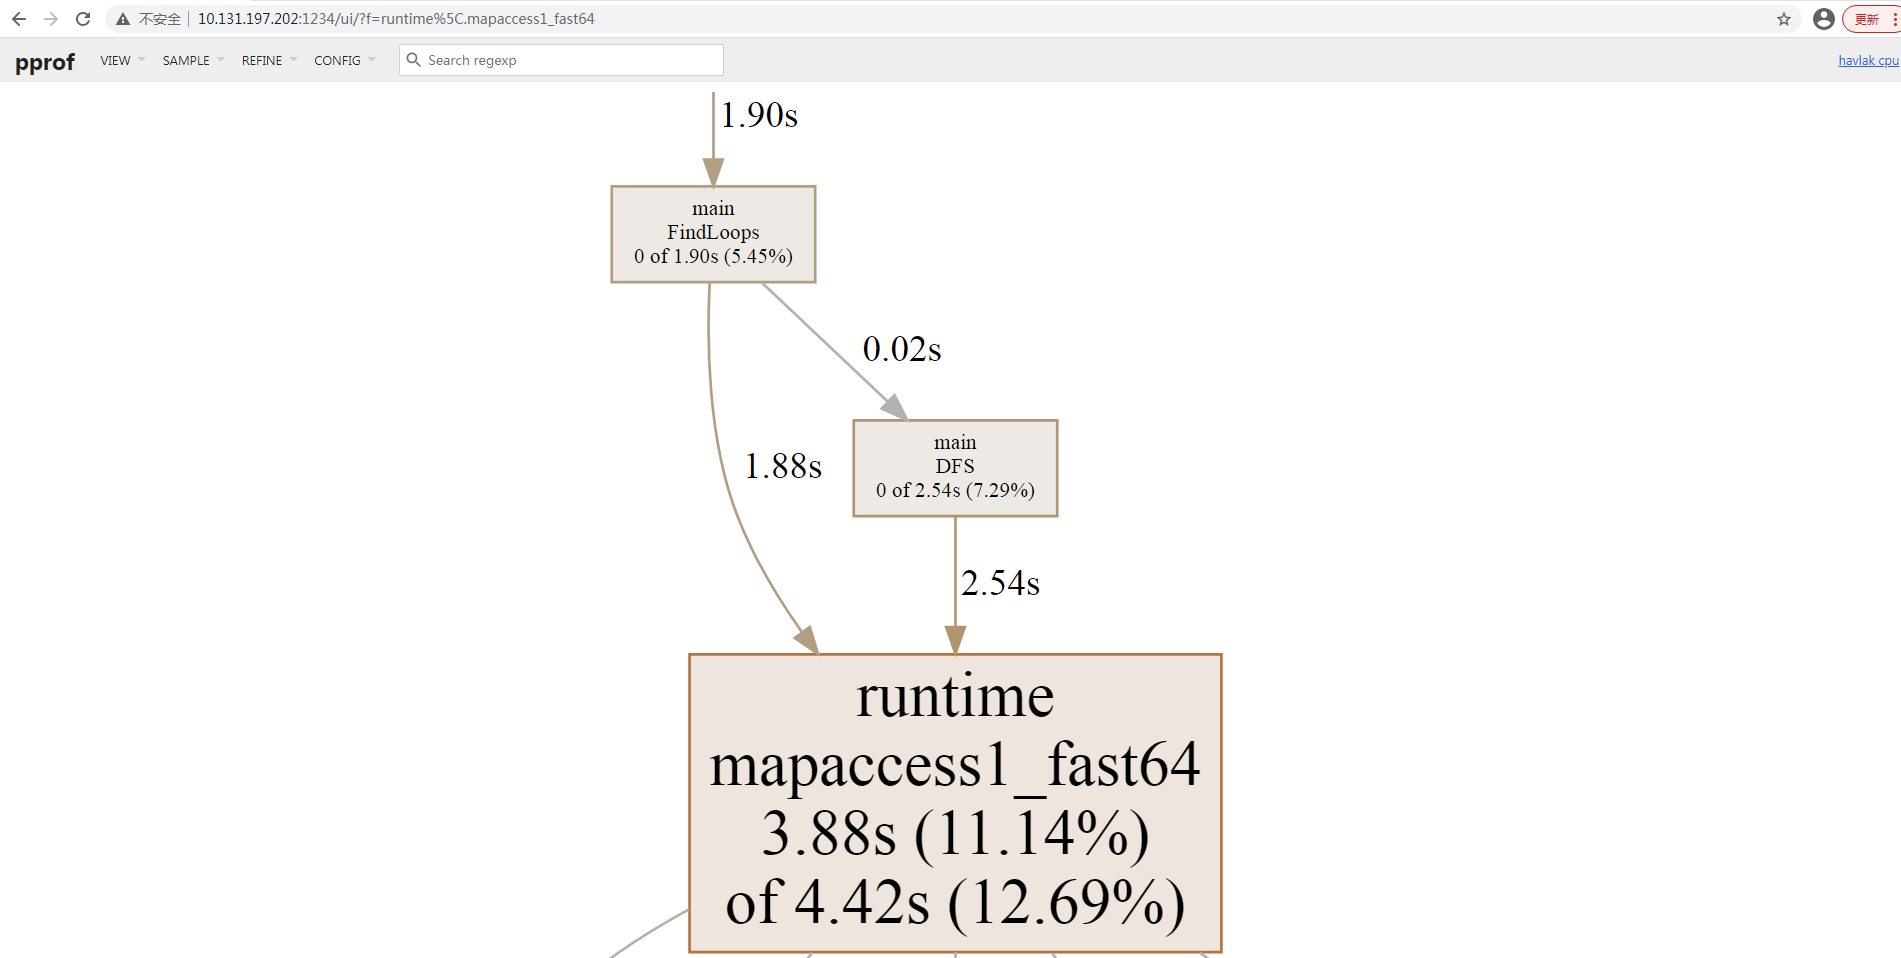
发现其调用来源主要有两个
main.DFS 2.54s, main.FindLoop 1.88s. 那么目前已经可以定位到函数级别了, 需要进一步定位到行级别(Source VIEW)的分析. 我选择查看main.DFS函数的Source VIEW;通过
Source VIEW, 借助于正字表达式过滤, 准确定位到main.DFS函数的源码标注: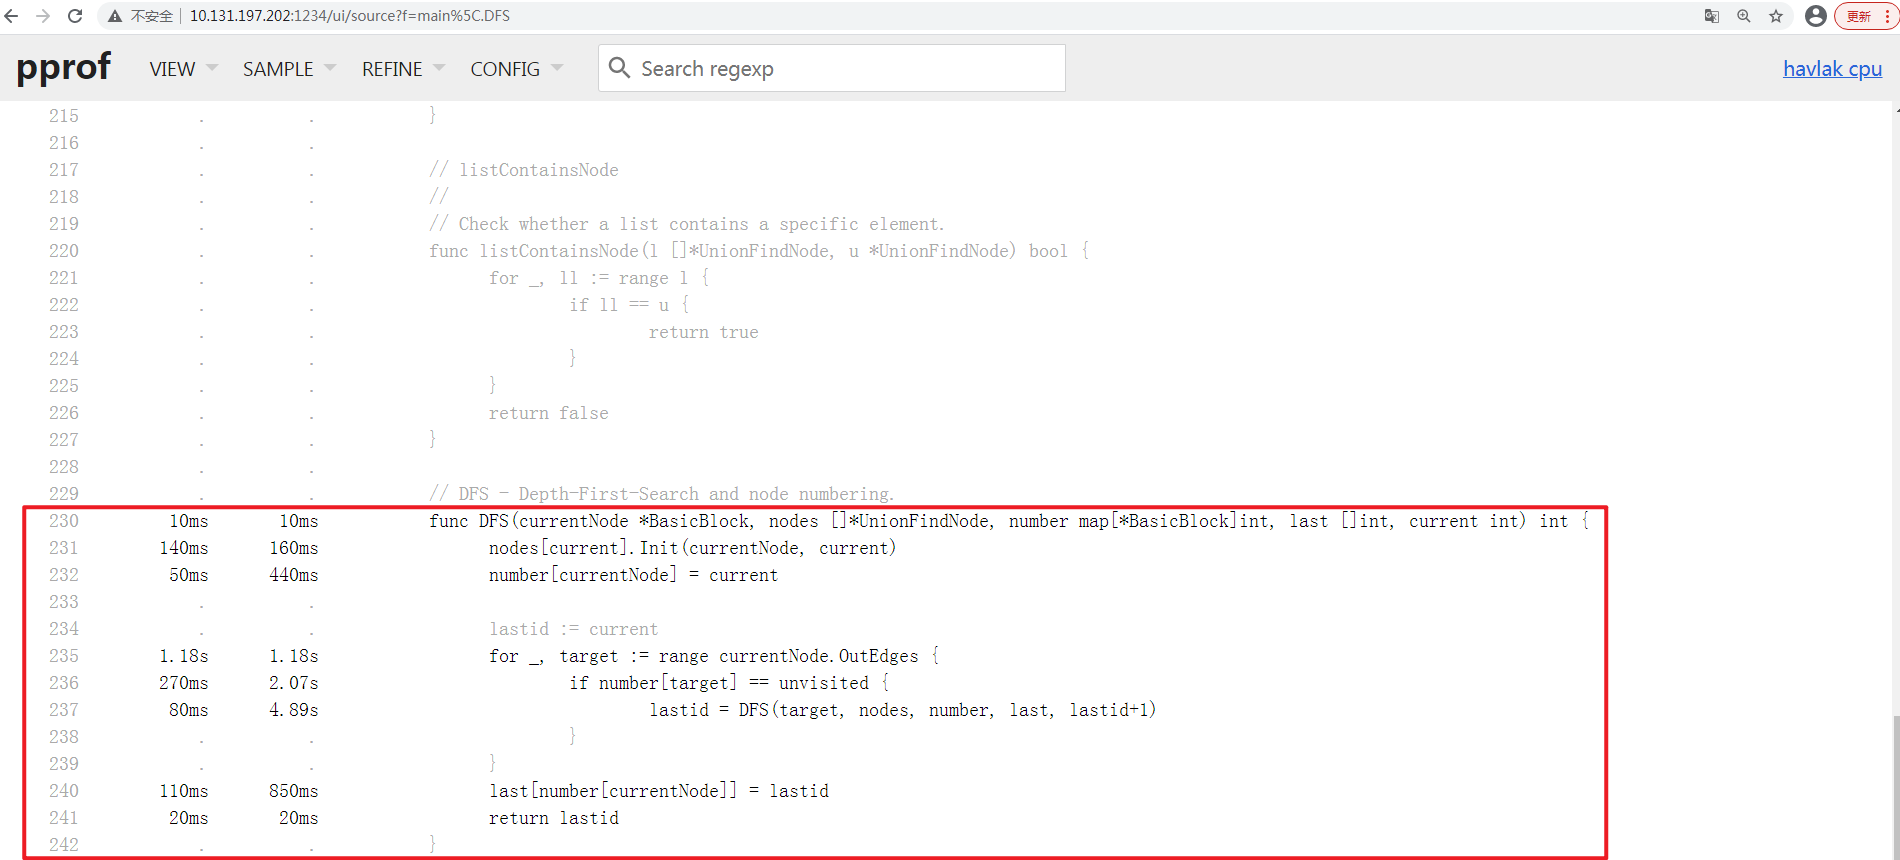
从上图可以看出:
cum维度上看: 时间开销较多的有,237行, 4.89s,236行, 2.07s,235行, 1.18s…其中
237行是递归, 235行是循环. 这种时间开销不可避免;236行在进行map索引过程, 其与Top VIEW中定位的runtime.mapaccess1_fast64是匹配的.是需要处理的;
进一步分析, 发现
236行操作的number变量, 在232行 440ms, 240行 850ms均在进行map索引操作.- 涉及`number`的map索引开销约`2.5s`, 可以进行优化;修改代码:
经过分析, 发现
number map变量主要用于标识代码块是否访问过. 而BasicBlock.Name int属性是唯一且范围可控, 可以通过[]int切片的方式进行等价处理, 具体代码差异为:1
2
3
4
5
6
7
8
9
10
11
12
13
14
15
16
17
18
19
20
21
22
23
24
25
26
27
28
29
30[root v2]# diff /home/learnGo-master/pkg/tools/pprof/runtime/v1/havlak.go /home/learnGo-master/pkg/tools/pprof/runtime/v2/havlak.go | sed 's/^/差异行: /'
差异行: 230c230
差异行: < func DFS(currentNode *BasicBlock, nodes []*UnionFindNode, number map[*BasicBlock]int, last []int, current int) int {
差异行: ---
差异行: > func DFS(currentNode *BasicBlock, nodes []*UnionFindNode, number []int, last []int, current int) int {
差异行: 232c232
差异行: < number[currentNode] = current
差异行: ---
差异行: > number[currentNode.Name] = current
差异行: 236c236
差异行: < if number[target] == unvisited {
差异行: ---
差异行: > if number[target.Name] == unvisited {
差异行: 240c240
差异行: < last[number[currentNode]] = lastid
差异行: ---
差异行: > last[number[currentNode.Name]] = lastid
差异行: 260c260
差异行: < number := make(map[*BasicBlock]int)
差异行: ---
差异行: > number := make([]int, size)
差异行: 276c276
差异行: < number[bb] = unvisited
差异行: ---
差异行: > number[bb.Name] = unvisited
差异行: 304c304
差异行: < v := number[nodeV]
差异行: ---
差异行: > v := number[nodeV.Name]重新编译并执行:
1
2
3
4[root@sangfor v2]# go build ./havlak.go
[root@sangfor v2]# ../xtime ./havlak
# of loops: 76000 (including 1 artificial root node)
26.71u 2.39s 20.65r 332400kB ./havlak发现
CPU时间开销已经下降了;Version User Time Sys Time Memory 优化前 42.51 s 4.31 s 316284 kB 优化CPU后 26.71 s 2.39 s 332400 kB 再此获得
cpuprofile文件查看:1
2
3
4
5
6
7
8
9
10[root@sangfor v2]# ./havlak -cpuprofile=cpu.prof
# of loops: 76000 (including 1 artificial root node)
[root@sangfor v2]# ll
total 2516
-rw-r--r--. 1 root root 27387 Dec 25 21:07 cpu.prof
-rwxr-xr-x. 1 root root 2525690 Dec 25 20:53 havlak
-rw-r--r--. 1 root root 16723 Dec 25 20:53 havlak.go
[root@sangfor v2]# go tool pprof -http=0.0.0.0:1234 ./cpu.prof
warning: GOPATH set to GOROOT (/usr/local/go/) has no effect
Serving web UI on http://0.0.0.0:1234发现
runtime.mapaccess1_fast6函数已经不再是瓶颈函数了;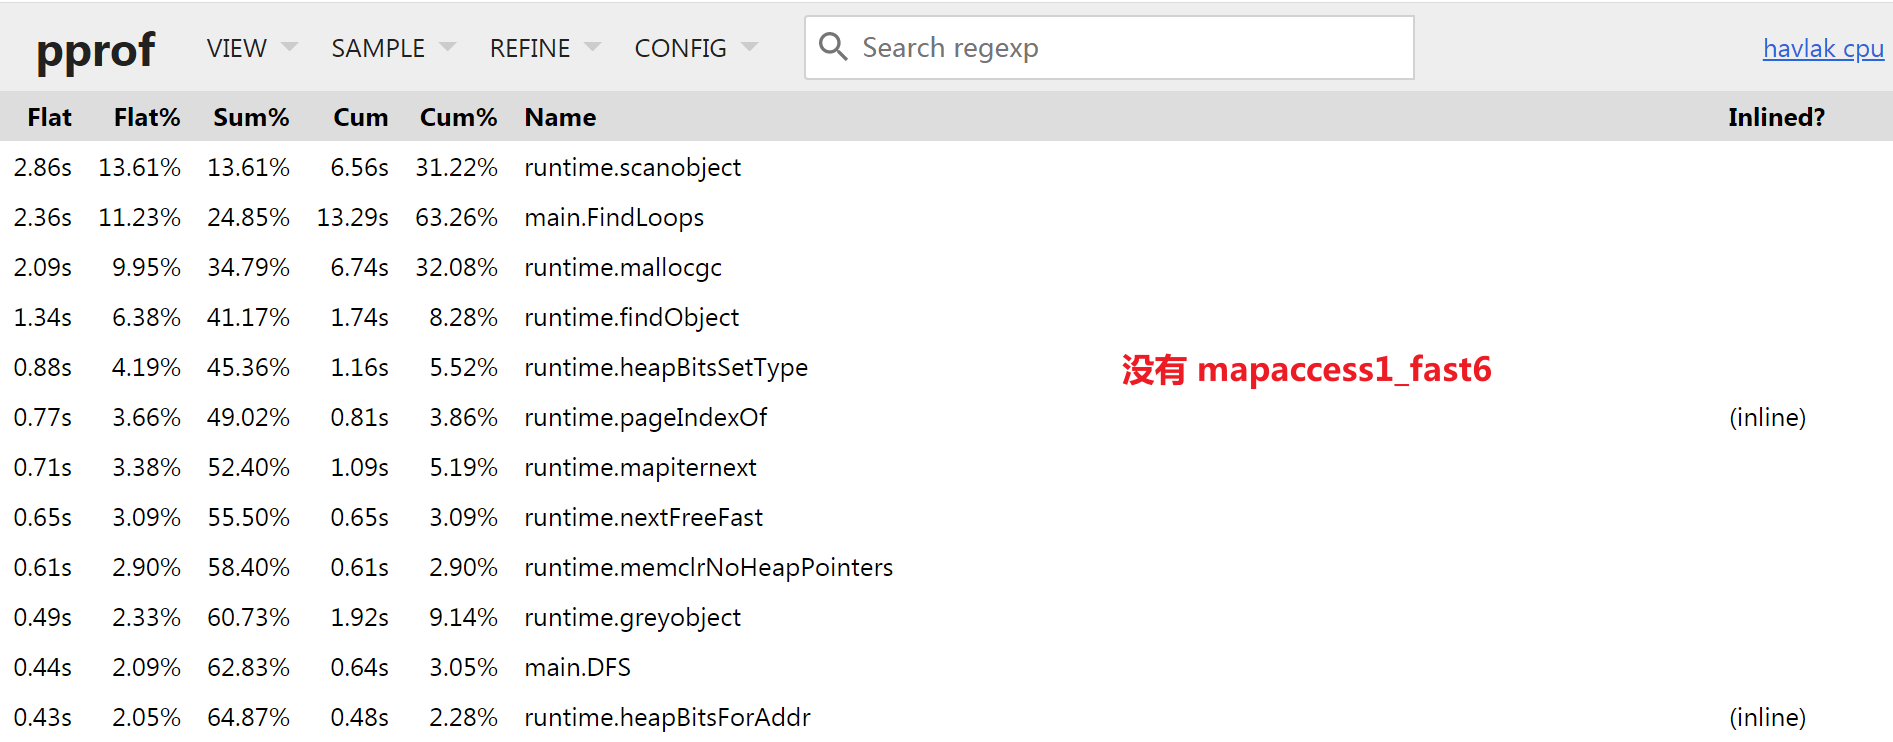
当前瓶颈函数:
runtime.scanobject,runtime.mallocgc… 均为GoGC机制使用, 需要进行内存分析;
内存分析
profiling data 生成:
嵌入
Mem Profile生成代码, 开启Mem Profiling功能;1
2
3
4
5
6
7
8
9
10
11
12
13
14
15
16
17
18
19
20
21
22
23
24var memprofile = flag.String("memprofile", "", "write memory profile to this file")
func main() {
flag.Parse()
...
if *memprofile != "" {
f, err := os.Create(*memprofile)
if err != nil {
log.Fatal("could not create memory profile: ", err)
}
defer f.Close() // error handling omitted for example
runtime.GC() // get up-to-date statistics
if err := pprof.WriteHeapProfile(f); err != nil {
log.Fatal("could not write memory profile: ", err)
}
}
for i := 0; i < 50; i++ {
FindHavlakLoops(cfgraph, NewLSG())
}
fmt.Printf("# of loops: %d (including 1 artificial root node)\n", lsgraph.NumLoops())
lsgraph.CalculateNestingLevel()
}- 代码位置约为
709行. 添加的代码部分, 其支持通过命令行参数-memprofile的方式,指定开启Mem Profiling功能的同时将profiling data输出在memprofile文件内;
- 代码位置约为
编译代码, 开启
Mem Profiling:1
2
3
4
5
6
7
8[root v3]# go build ./havlak.go
[root v3]# ./havlak -memprofile=mem.prof
of loops: 76000 (including 1 artificial root node)
[root@sangfor v3]# ll
total 2556
-rwxr-xr-x. 1 root root 2591320 Dec 25 21:18 havlak
-rw-r--r--. 1 root root 17170 Dec 25 21:13 havlak.go
-rw-r--r--. 1 root root 1891 Dec 25 21:18 mem.profprofilinf data分析:开启
Interactive Web, 查看Mem Profiling data通过
go tool pprof -http=host:port source命令, 可以在指定端口允许通过Web查看Mem Profiling data;1
2
3[root v3]# go tool pprof -http=0.0.0.0:1234 ./mem.prof
Serving web UI on http://0.0.0.0:1234
http://0.0.0.0:1234同样的默认展示
Graph VIEW: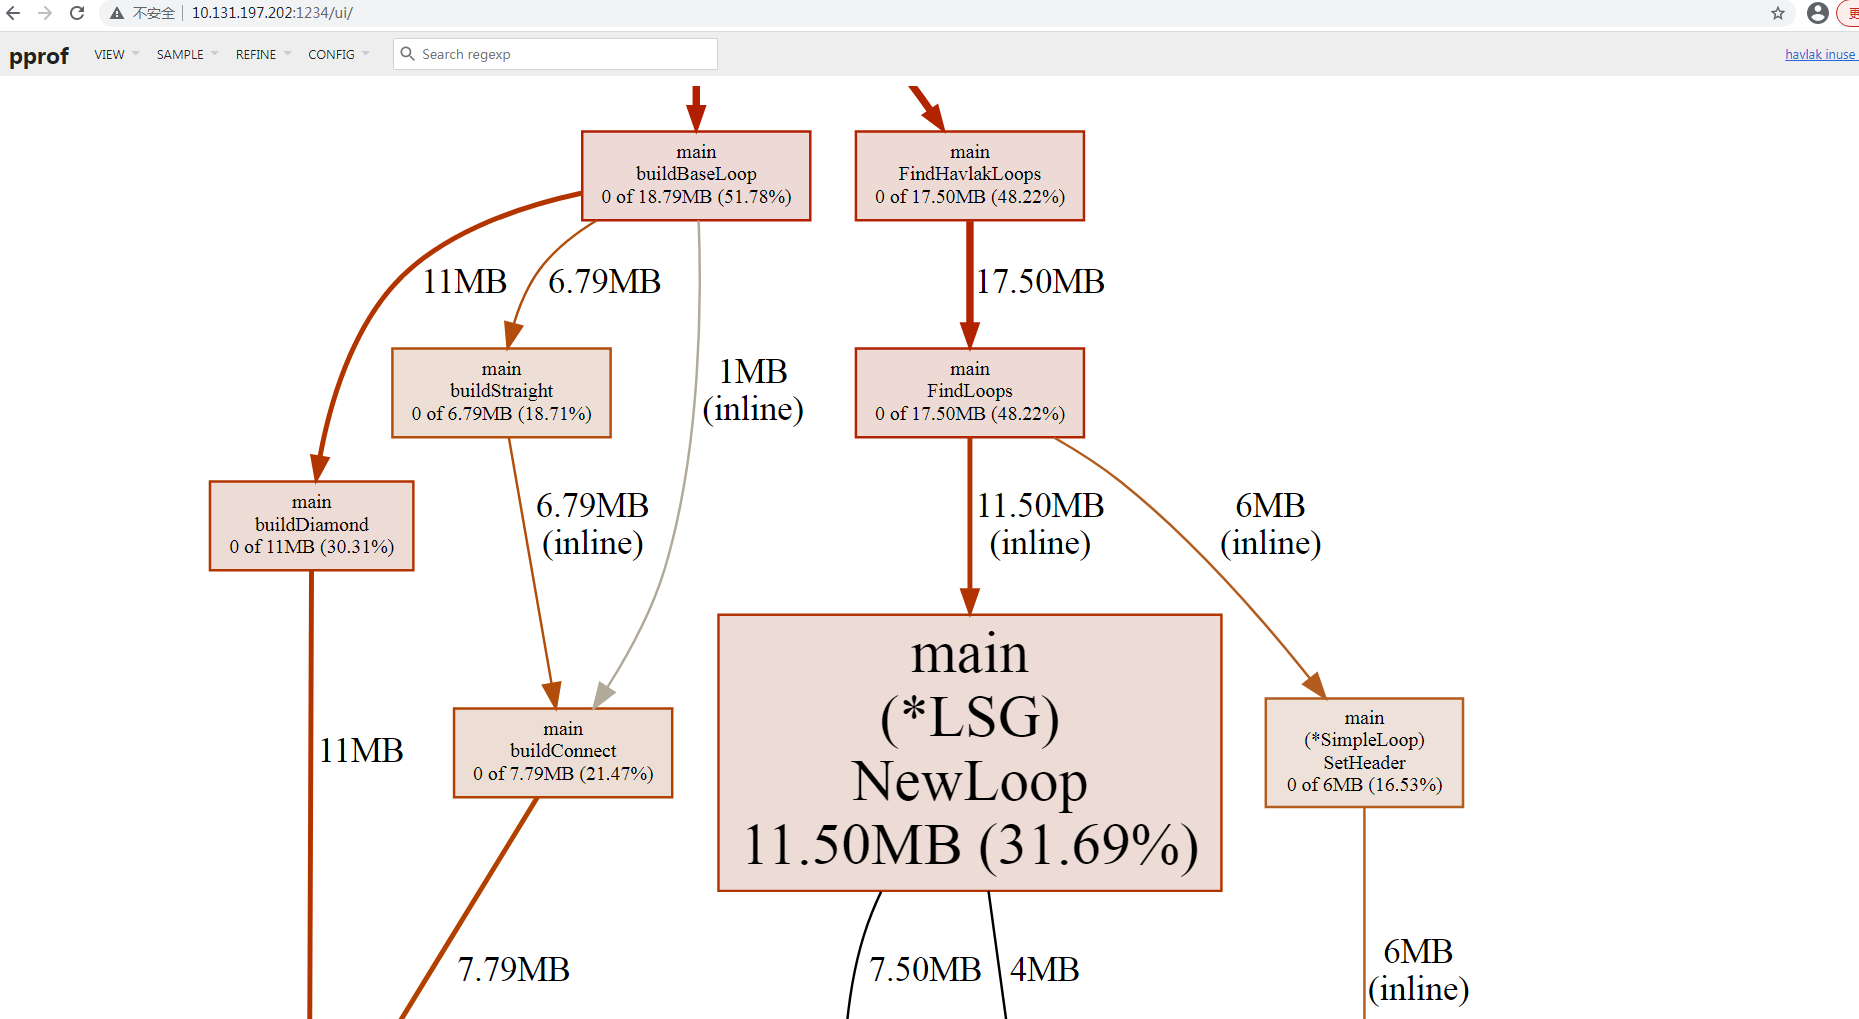
界面解释: 基本与
CPU一致, 不解释;分析:
通过
Top VIEW查看瓶颈函数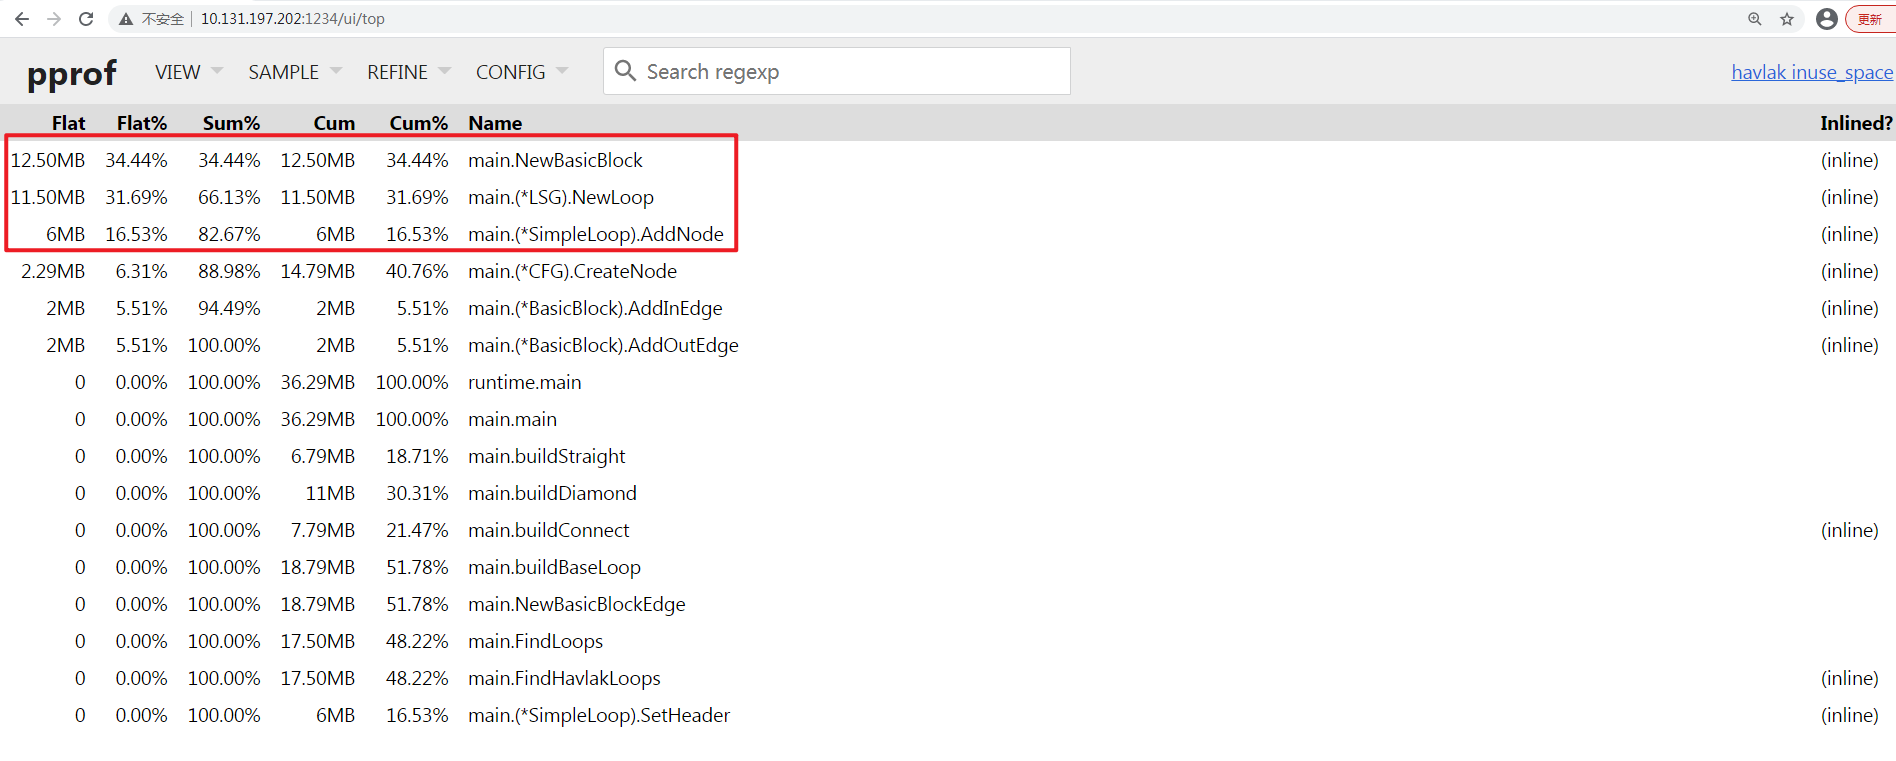
前三列占据了8成的内存占用, 瓶颈函数分别为
main.NewBasicBlock, main.(*LSG).NewLoop, main.(*SimpleLoop).AddNode;通过
graph VIEW模式查看其调用情况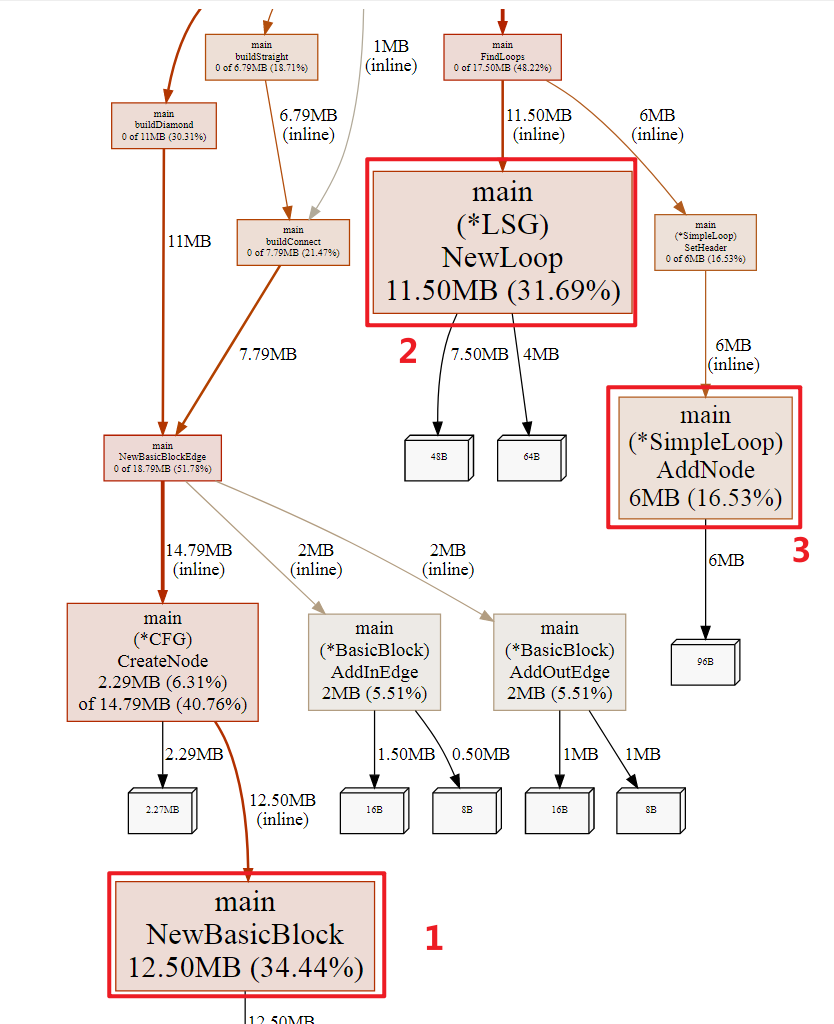
发现上面的函数均进行了
inline优化处理, 对于性能分析来说,inline优化会导致Source VIEW模式无法直接定位到inline function, 例如查看main.(*LSG).NewLoop, 显示找不到: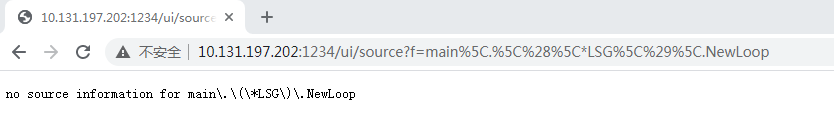
对于此, 我两种处理方案:
继续使用当前
profiling data方案: 可以通过no-inline的父调用函数进行Source VIEW查验, 例如其调用函数main.FindLoops函数未进行inline处理,如下图: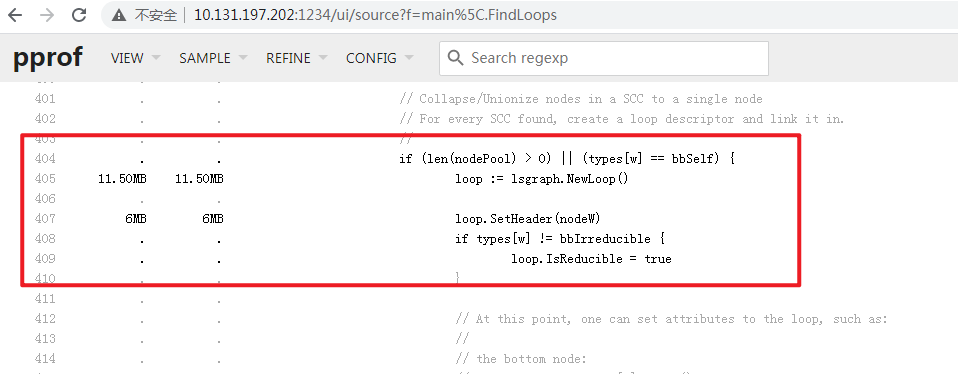
发现405行中,
lsgraph.NewLoop()函数占用了11.50MB的内存, 其标注如下图: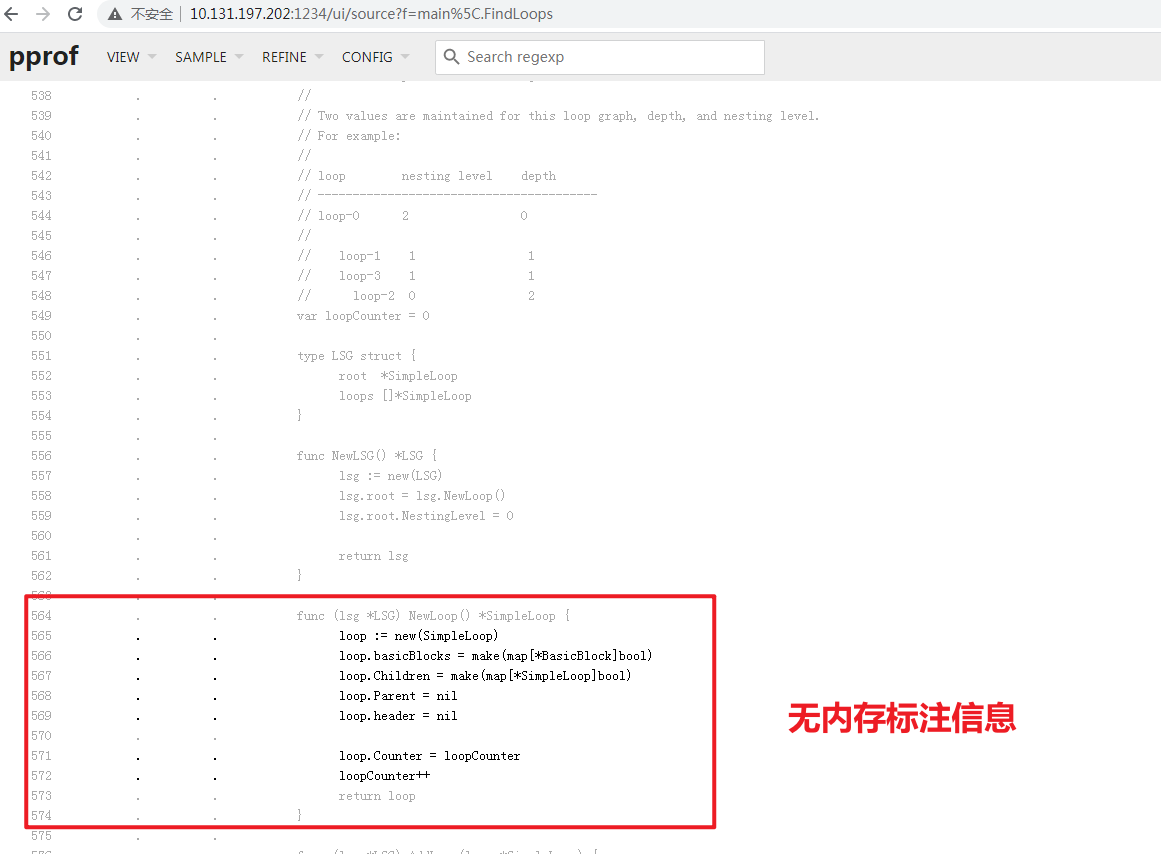
个人再自行通过代码阅读的方式, 排查上述代码. 例如我们知道
566行, 567行的 make()函数会进行内存分配操作, 也许这里是优化项.使用
no-inline版本的profiling data, 重新编译并指定不采用inline优化, 随后再次生成一份profiling data:1
2
3
4
5
6
7
8
9
10
11
12
13
14
15
16
17
18
19[root v3]# go build -o havlak-without-inline -gcflags=-l ./havlak.go
[root v3]# ll
total 5092
-rwxr-xr-x. 1 root root 2591320 Dec 25 21:18 havlak
-rw-r--r--. 1 root root 17170 Dec 25 21:13 havlak.go
-rwxr-xr-x. 1 root root 2595129 Dec 26 09:44 havlak-without-inline
-rw-r--r--. 1 root root 1891 Dec 25 21:18 mem.prof
[root v3]# ./havlak-without-inline -memprofile=mem-without-inline.prof
of loops: 76000 (including 1 artificial root node)
[root v3]# ll
total 5096
-rwxr-xr-x. 1 root root 2591320 Dec 25 21:18 havlak
-rw-r--r--. 1 root root 17170 Dec 25 21:13 havlak.go
-rwxr-xr-x. 1 root root 2595129 Dec 26 09:44 havlak-without-inline
-rw-r--r--. 1 root root 1891 Dec 25 21:18 mem.prof
-rw-r--r--. 1 root root 2017 Dec 26 09:46 mem-without-inline.prof
[root v3]# go tool pprof -http=0.0.0.0:1234 ./mem-without-inline.prof
Serving web UI on http://0.0.0.0:1234
http://0.0.0.0:1234可以在Web上看到均无
inline标识, 可以直接利用Source VIEW定位: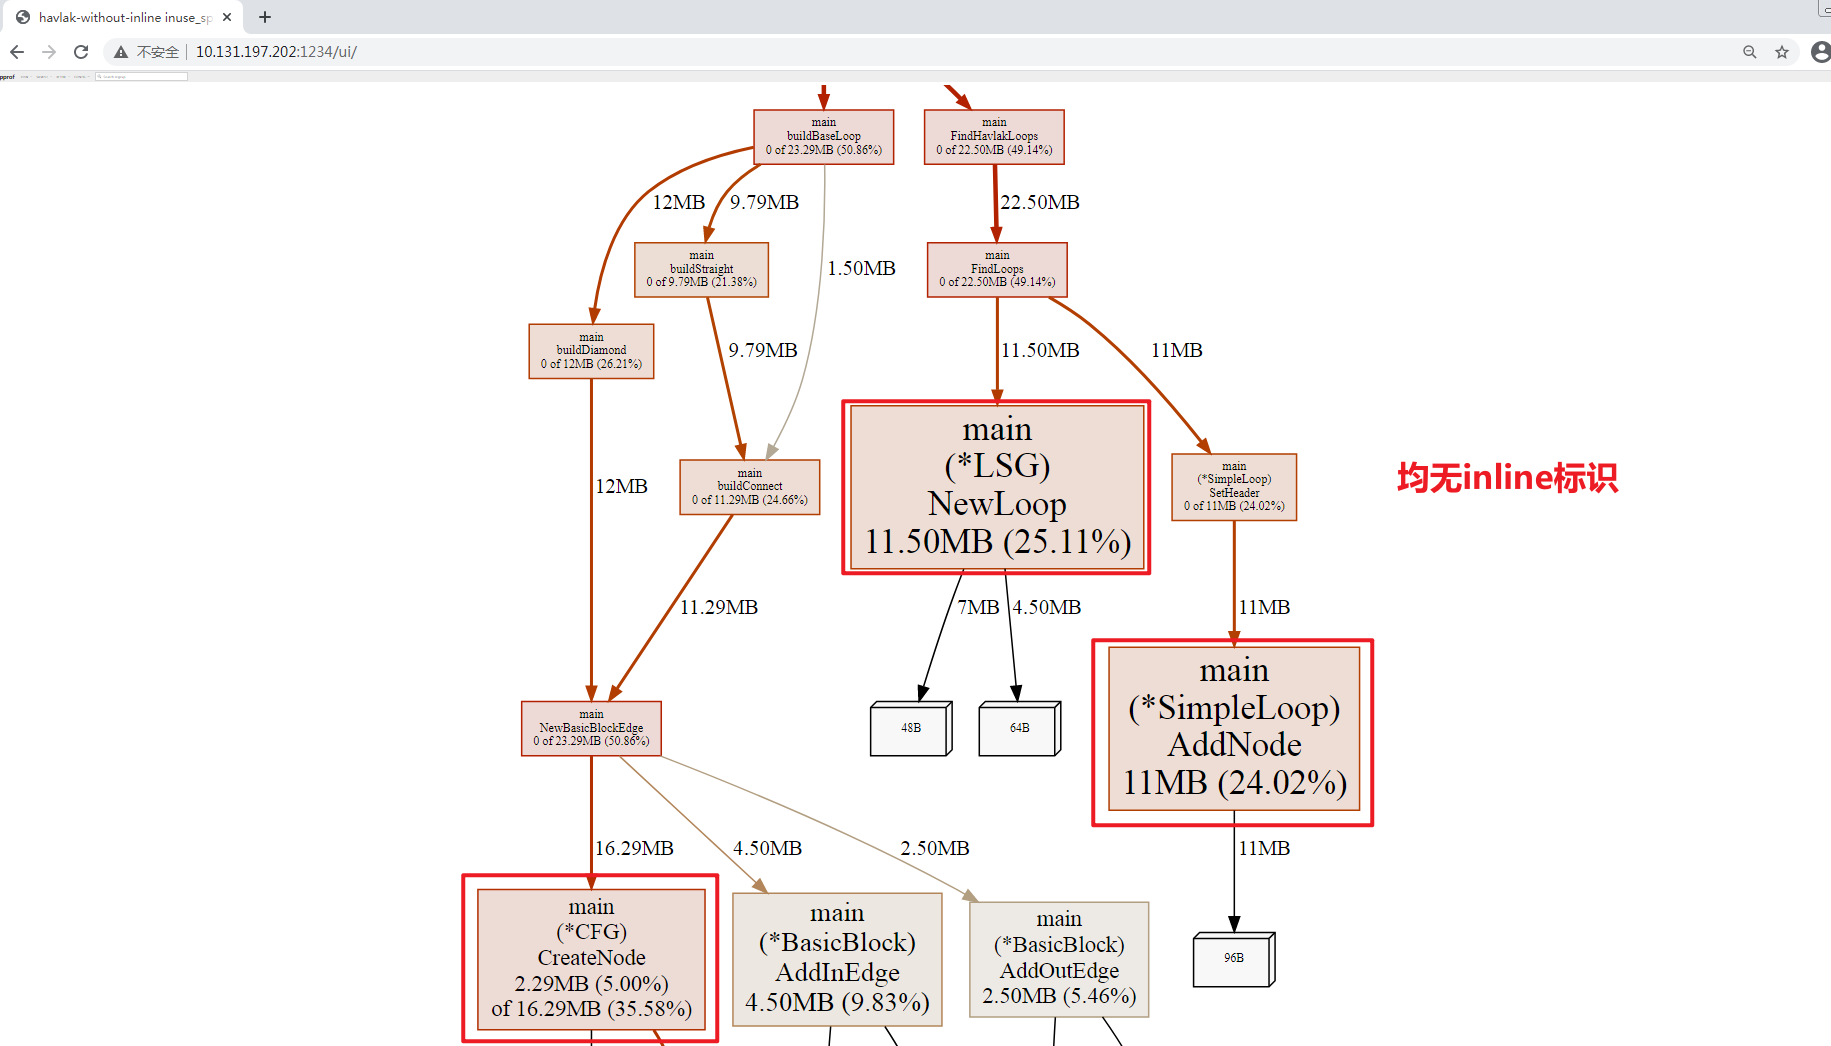
个人在使用时, 采用了此种方案.
通过
Source VIEW, 借助于正字表达式过滤, 准确定位到main.(*LSG).NewLoop函数的源码标注, 如下图: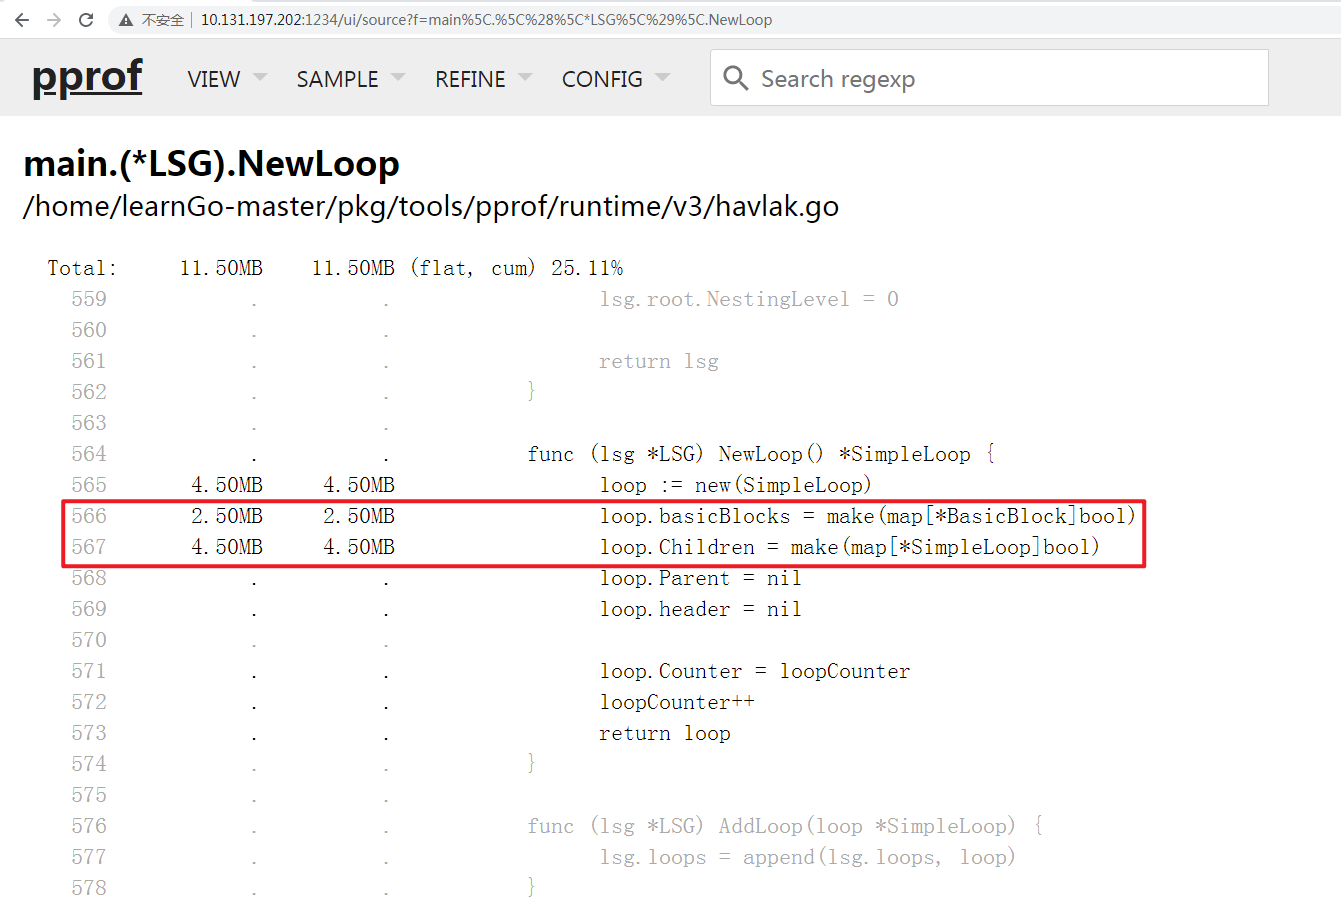
发现
566行, 567行 make()函数占用了约7MB的内存开销, 并且进一步分析发现basicBlocks, Children可以通过切片的方式替换Map, 这会减少内存开销;在随后的分析中, 发现其他业务代码也有类似的问题, 并一并进行了优化处理, 这里就不一一赘述了, 具体文件差异如下:
1
2
3
4
5
6
7
8
9
10
11
12
13
14
15
16
17
18
19
20
21
22
23
24
25
26
27
28
29
30
31
32
33
34
35
36
37
38
39
40
41
42
43
44
45
46
47
48
49
50
51
52
53
54
55
56
57
58
59
60
61
62
63[root ~]# diff /home/learnGo-master/pkg/tools/pprof/runtime/v3/havlak.go /home/learnGo-master/pkg/tools/pprof/runtime/v4/havlak.go | sed 's/^/差异行: /'
差异行: 244a245,253
差异行: > func appendUnique(a []int, x int) []int {
差异行: > for _, y := range a {
差异行: > if x == y {
差异行: > return a
差异行: > }
差异行: > }
差异行: > return append(a, x)
差异行: > }
差异行: >
差异行: 258c267
差异行: < nonBackPreds := make([]map[int]bool, size)
差异行: ---
差异行: > nonBackPreds := make([][]int, size)
差异行: 276c285
差异行: < for i, bb := range cfgraph.Blocks {
差异行: ---
差异行: > for _, bb := range cfgraph.Blocks {
差异行: 278d286
差异行: < nonBackPreds[i] = make(map[int]bool)
差异行: 313c321
差异行: < nonBackPreds[w][v] = true
差异行: ---
差异行: > nonBackPreds[w] = appendUnique(nonBackPreds[w], v)
差异行: 389c397
差异行: < nonBackPreds[w][ydash.dfsNumber] = true
差异行: ---
差异行: > nonBackPreds[w] = appendUnique(nonBackPreds[w], ydash.dfsNumber)
差异行: 464,465c472,473
差异行: < basicBlocks map[*BasicBlock]bool
差异行: < Children map[*SimpleLoop]bool
差异行: ---
差异行: > basicBlocks []*BasicBlock
差异行: > Children []*SimpleLoop
差异行: 477c485
差异行: < loop.basicBlocks[bb] = true
差异行: ---
差异行: > loop.basicBlocks = append(loop.basicBlocks, bb)
差异行: 481c489
差异行: < loop.Children[child] = true
差异行: ---
差异行: > loop.Children = append(loop.Children, child)
差异行: 499c507
差异行: < for ll := range loop.Children {
差异行: ---
差异行: > for _, ll := range loop.Children {
差异行: 505c513
差异行: < for bb := range loop.basicBlocks {
差异行: ---
差异行: > for _, bb := range loop.basicBlocks {
差异行: 566,567d573
差异行: < loop.basicBlocks = make(map[*BasicBlock]bool)
差异行: < loop.Children = make(map[*SimpleLoop]bool)
差异行: 587c593
差异行: < for ll := range loop.Children {
差异行: ---
差异行: > for _, ll := range loop.Children {
差异行: 606c612
差异行: < for ll := range loop.Children {
差异行: ---
差异行: > for _, ll := range loop.Children {重新编译并执行:
1
2
3
4
5
6
7
8[root@sangfor v4]# go build ./havlak.go
[root@sangfor v4]# ll
total 2556
-rwxr-xr-x. 1 root root 2590786 Dec 26 10:33 havlak
-rw-r--r--. 1 root root 17240 Dec 26 10:26 havlak.go
[root@sangfor v4]# ../xtime ./havlak
of loops: 76000 (including 1 artificial root node)
11.64u 1.24s 8.49r 176892kB ./havlak发现
Mem开销下降了, 并且CPU时间开销也随之下降, 性能有所提升;Version User Time Sys Time Memory 优化前 42.51 s 4.31 s 316284 kB 优化CPU后 26.71 s 2.39 s 332400 kB 优化CPU+MEM后 11.64 s 1.24 s 176892 kB
性能对比
| Version | User Time | Opt | Sys Time | Opt | Memory | Opt |
|---|---|---|---|---|---|---|
| 优化前 | 42.51 s | 0 | 4.31 s | 0 | 316284 kB | 0 |
| 优化CPU后 | 26.71 s | 37.17 % | 2.39 s | 44.55 % | 332400 kB | -5% |
| 优化CPU+MEM后 | 11.64 s | 72.62 % | 1.24 s | 71.23 % | 176892 kB | 44.07% |
优化率计算公式(优化前-优化后)/优化前
参考
- https://github.com/google/pprof/blob/main/doc/README.md
- https://go.dev/blog/pprof
- https://protobuf.dev/
- https://github.com/google/pprof
- https://golang.google.cn/pkg/runtime/pprof/
- https://github.com/eddycjy/blog/blob/master/content/posts/go/tools/2018-09-15-go-tool-pprof.md
- https://zhuanlan.zhihu.com/p/141640004
- https://zhuanlan.zhihu.com/p/51559344
- https://juejin.cn/post/7193865759825592375
- https://zhuanlan.zhihu.com/p/373874739